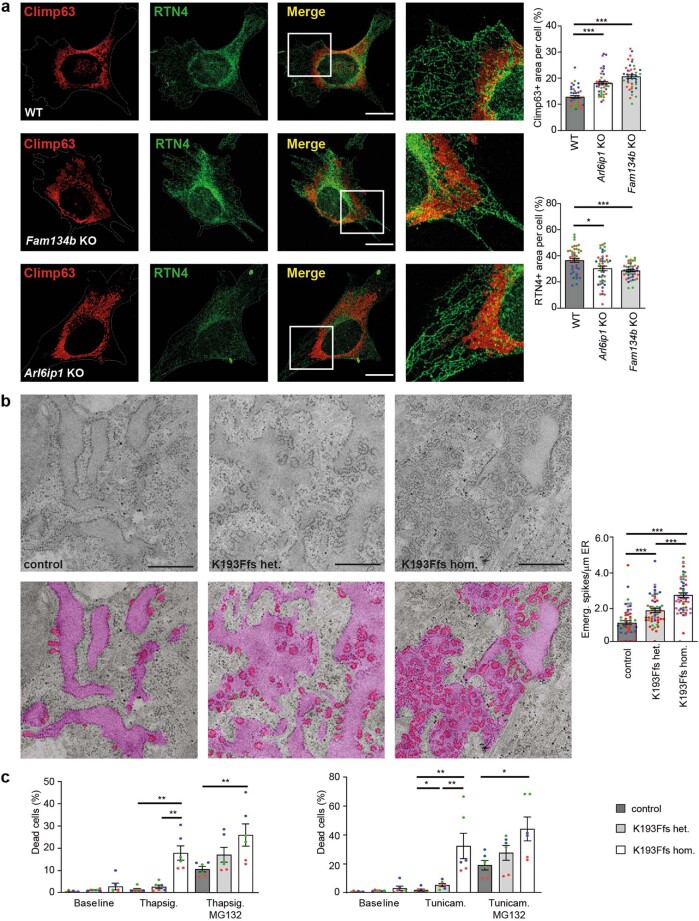
Extended Data Fig. 10. Consequences of compromised FAM134B-dependent ER-phagy for ER structure and cell viability.
a) Staining for the ER sheet protein Climp63 and the ER tubule marker RTN4 in WT and Fam134b and Arl6ip1 KO MEFs. Relative Climp63-positive or RTN4-positive pixels per cell and their ratio was calculated (3 exp. with 45 cells analysed per genotype; Kruskal-Wallis test with Dunn’s multiple comparisons test: Climp63 WT versus Arl6ip1 KO p = 0.0001, WT versus Fam134b KO p = 0.0001; RTN4 WT versus Arl6ip1 KO p = 0.036, WT versus Fam134b KO p = 0.0005; data points obtained within the same experiment are indicated by the same colour). Scale bar: 10 µm. b) Compared with the strongly increased number of small highly curved ER protrusions emanating from ER sheets in fibroblasts of the homozygous patient, fibroblasts of the heterozygous father show an intermediate phenotype (1 exp. with 55 cells per genotype; one-way ANOVA with Bonferroni post-hoc analysis, F-value 42,59, p = 0.0001: WT versus K193Ffs het. p = 0.0002, WT versus K193Ffs hom. p = 0.0001, K193Ffs hom. versus K193Ffs het. p = 0.0001; data points obtained within the same experiment are indicated by the same colour). Scale bar: 500 nm. The ER is shown in light purple colour. ER-emerging spikes are shown in pink. c) In the presence of the ER stressor Tunicamycin without the proteasomal inhibitor MG132 the viability of the fibroblasts of the heterozygous father is slightly increased compared to control (3 experiments with 2 replicates each; 2-sided Mann-Whitney-U-test; Thapsigargin: WT versus K193Ffs hom. p = 0.0022, K193Ffs het. versus K193Ffs hom. p = 0.0022; Thapsigargin + MG132: WT versus K193Ffs hom. p = 0.0087; Tunicamycin: WT versus K193Ffs het. p = 0.0411, WT versus K193Ffs hom. p = 0.0022; K193Ffs het. versus K193Ffs hom. p = 0.0022; Tunicamycin+MG132: WT versus K193Ffs hom. p = 0.026). Individual experiments are indicated by differently coloured data points. Quantitative data are shown as mean ± SEM.

