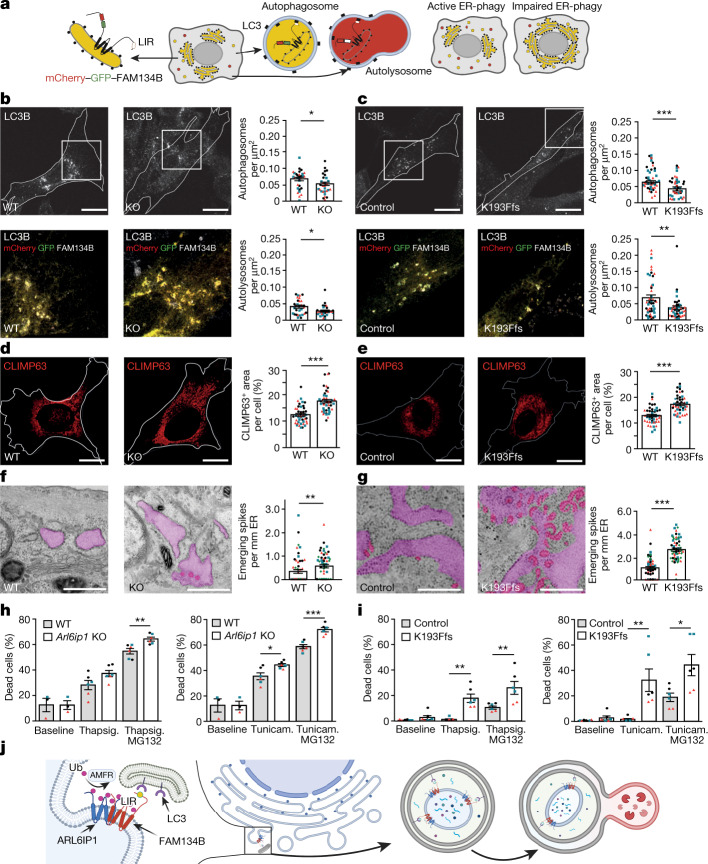
Fig. 5. FAM134B-mediated ER-phagy requires ARL6IP1 in mice and humans.
a, Rational of the mCherry–GFP–FAM134B reporter. b,c, ARL6IP1 loss-of-function compromises ER-phagy. Arl6ip1 WT and KO MEFs (b) or fibroblasts from the patient and the healthy individual (control) (c) were transfected with mCherry–GFP–FAM134B and stained for LC3B. Quantifications of LC3B+mCherry+GFP+ puncta and LC3B+mCherry+GFP– puncta per cell area suggest that the formation of autophagosomes (3 experiments with 10 cells per genotype each; two-sided Mann–Whitney U-test; MEFs, P = 0.0479; human cells, P = 0.0005) and autolysosomes (3 experiments with 10 cells per genotype each; two-sided Mann–Whitney U-test; MEFs, P = 0.0307; human cells, P = 0.0096) is impaired. d,e, ARL6IP1 loss-of-function enlarges ER sheets. Arl6ip1 WT and KO MEFs (d) or fibroblasts from the patient and healthy individual (e) were stained for the ER sheet protein CLIMP63 and the relative CLIMP63+ area per cell calculated (3 experiments with 15 cells per genotype; two-sided Mann–Whitney U-test; MEFs, P = 0.0001; human cells, P = 0.0001). f,g, TEM images showed increased numbers of small highly curved ER protrusions emanating from ER sheets in the absence of ARL6IP1 (ER sheets in light purple, ER-emerging spikes in pink) in MEFs (f) and human fibroblasts (g) (1 experiment with 55 cells per genotype; two-sided Mann–Whitney U-test; P = 0.0059 (f) and P = 0.0001 (g)). h,i, ARL6IP1 loss-of-function decreases cell viability in the presence of the ER stressors tunicamycin (Tunicam.) or thapsigargin (Thapsig.) with or without the proteasome inhibitor MG132 in MEFs (h) and human fibroblasts (i) (3 experiments with 2 replicates; two-sided Mann–Whitney U-test; MEFs, thapsigargin + MG132, P = 0.0022; tunicamycin, P = 0.041; tunicamycin + MG132, P = 0.0022; patient cells, thapsigargin, P = 0.0022; thapsigargin + MG132, P = 0.0087; tunicamycin, P = 0.0022; tunicamycin + MG132, P = 0.026). j, Cartoon showing ARL6IP1 (blue) ubiquitinated (red balls) by AMFR in a complex with FAM134B (red), which binds to LC3 (purple) during ER-phagy. Quantitative data are shown as the mean ± s.e.m. Individual experiments are indicated by differently coloured data points. Scale bars, 500 nm (f,g), 10 µm (d,e) or 20 µm (b,c). The models in a and j were created using BioRender (https://www.biorender.com).

