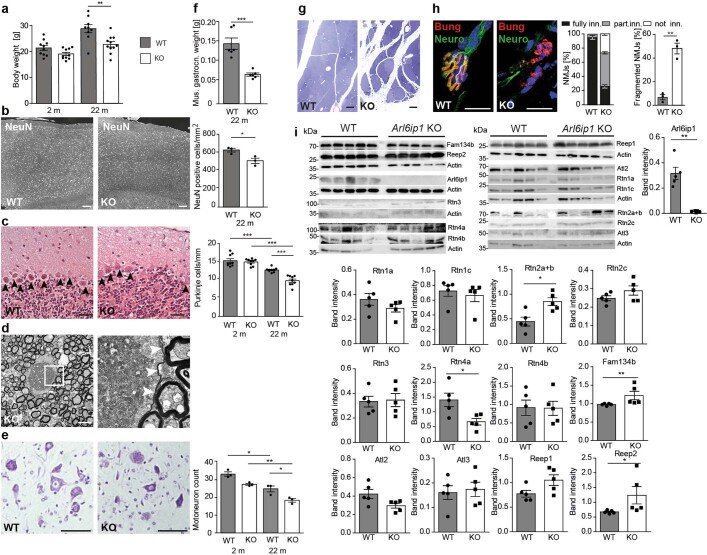
Extended Data Fig. 1. Phenotype of Arl6ip1 KO mice.
a) The body weight of KO mice is reduced (2 months: 15 WT and 15 KO mice; 22 months: 9 WT and 11 KO mice; 2-sided unpaired Student’s t-test: p = 0.0034). b) Cortical neurons are decreased in aged KO mice. Cross sections of the motor cortex of 22-month-old WT and KO mice with NeuN-labelled neurons (1 exp.; 3 mice per genotype; 2-sided unpaired Student’s t-test: p = 0.0312). Scale bars: 50 µm. c) Progressive Purkinje cell loss in KO mice. Representative images of the Purkinje cell layer of HE-stained sagittal cerebellum sections of 22-month-old WT and KO mice (1 exp.; n = 3 mice with 3 sections each per genotype; 2-sided unpaired Student’s t-test: WT 2 versus WT 22 months, p = 0.0002; KO 2 versus KO 22 months p = 0.0001, KO versus WT 22 months p = 0.0001). Scale bars: 100 µm. d) Swollen corticospinal axon in the lumbar spinal cord of a 6-month-old KO mouse (1 exp.). TEM of a horizontal spinal cord section. Scale bar: 5 µm. The higher magnification shows the accumulation of granular electron-dense material, defective organelles and tubulofilamentous material. The axon is surrounded by a distended myelin sheath (arrowheads). Scale bar: 1 µm. e) Progressive α-motoneuron loss in the thoracic spinal cord of KO mice. Nissl-stained horizontal sections (1 exp.; 3 mice per genotype; 2-sided unpaired Student’s t-test: WT 22 versus KO 22 months p = 0.0322, KO 2 versus KO 22 months p = 0.0018, WT 2 versus WT 22 months p = 0.0154). f) The Musculus gastrocnemius mass is reduced in 2-month-old KO mice (1 exp.; 3 WT and 3 KO mice with 2 samples each (left and right); 2-sided unpaired Student’s t-test: p = 0.001). g) Grouped atrophic skeletal muscle fibres in 20-week-old KO mice. Toluidine-blue stained semi-thin sections (1 exp.). Scale bar: 100 µm. h) Fragmentation and innervation loss of neuromuscular junctions (NMJ) in the Musculus gastrocnemius of 2-month-old KO mice stained with α-bungarotoxin (red), neurofilament 200 (green) and Hoechst 33258 (1 exp.; 3 mice per genotype). 2-sided unpaired Student’s t-test for fragmentation (p = 0.0012). i) The abundance of some ER proteins with RHDs is changed in brain lysates of 5-month-old KO mice (1 exp. with 5 samples per genotype; 2-sided Mann-Whitney-U-test: Rtn2a+b p = 0.0317, Rtn4a p = 0.0317, Fam134b p = 0.0079, Reep2 p = 0.0159). Quantitative data are shown as mean ± SEM.

