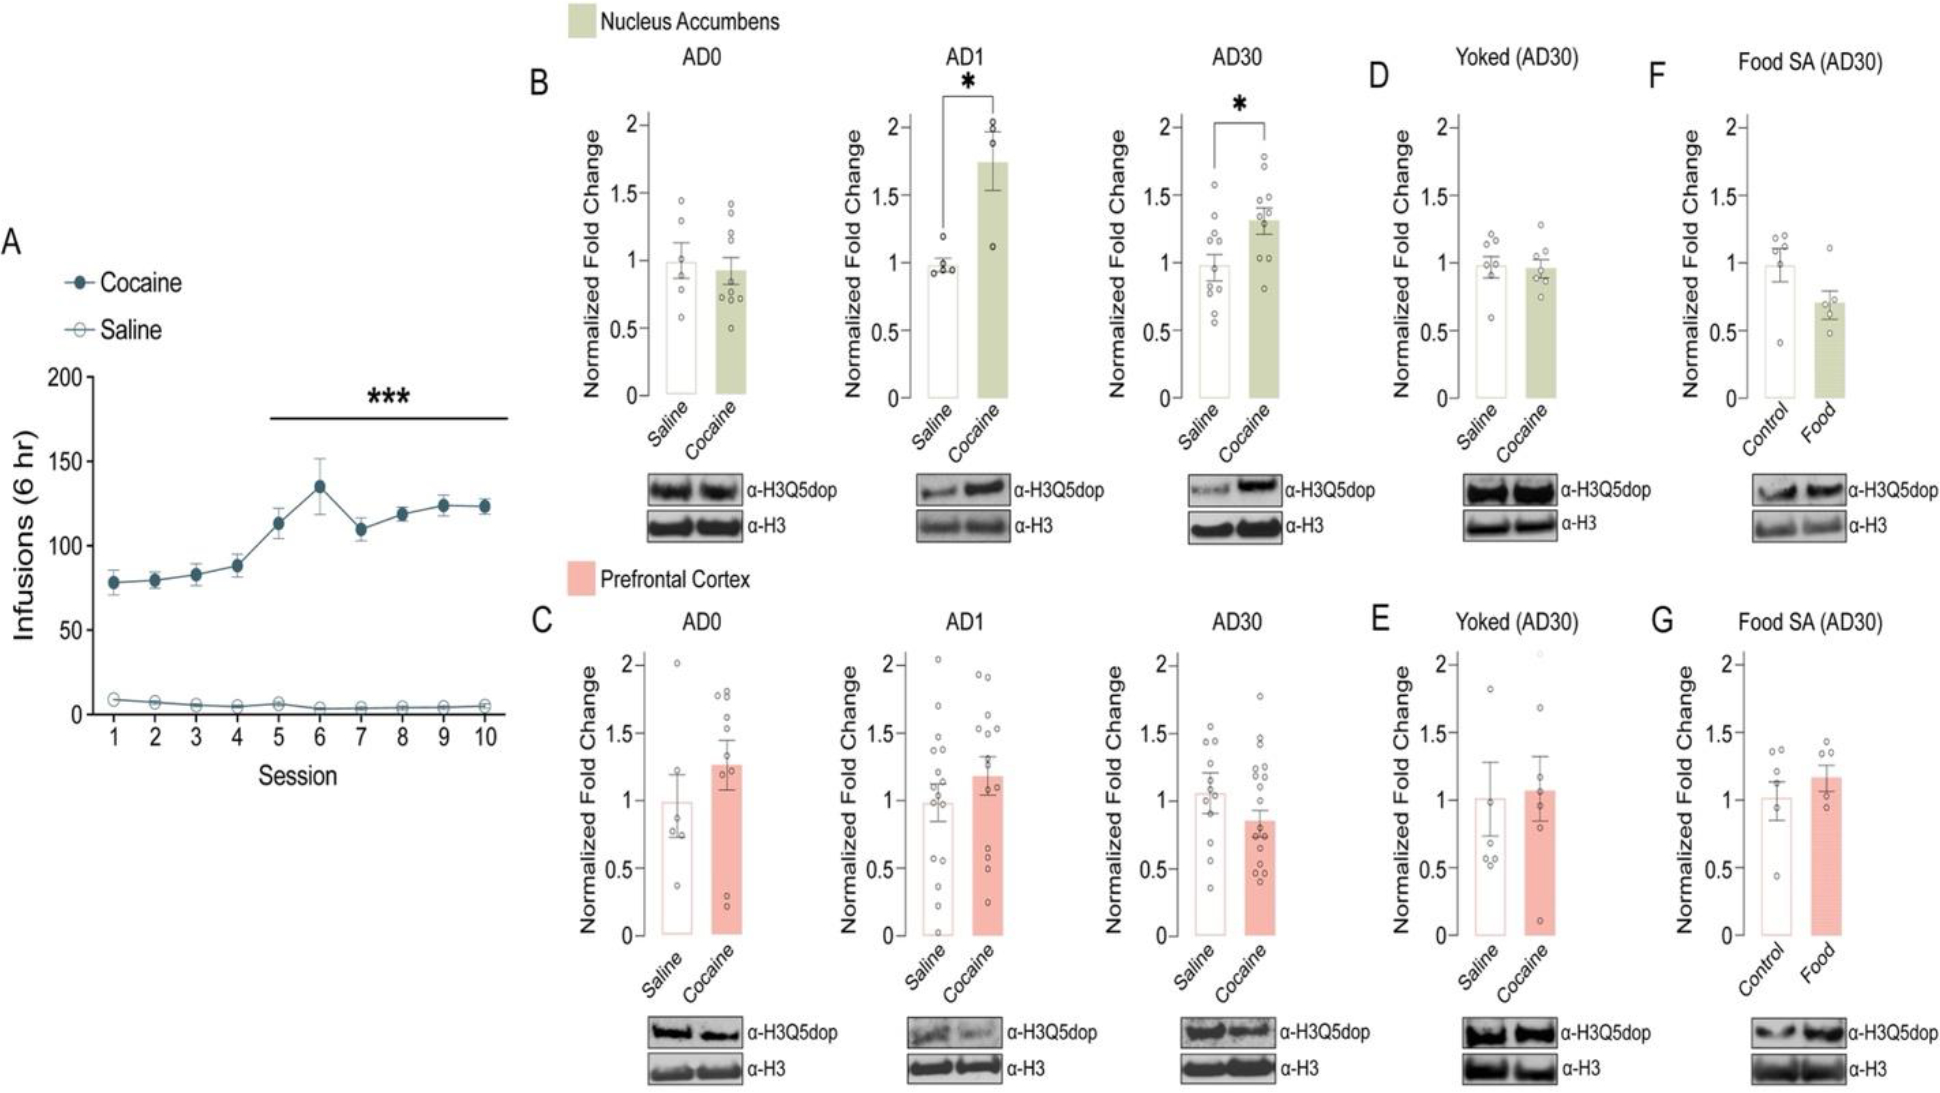
Figure 1. H3Q5dop accumulates in NAc, but not mPFC, following abstinence from cocaine SA.

(A) Number of infusions earned in daily 6-hour test sessions (FR5) for rats self-administering saline (non-reinforcement controls) or cocaine (0.5 mg/kg/infusion). Extended access, cocaine vs. saline: two-way repeated measures ANOVA, with Bonferroni post hoc analysis vs. day 1, ***p<0.001 (n = 21/group). Analysis of H3Q5dop in (B) NAc (n = 4–11/group/time point) or (C) mPFC (n = 6–17/group/time point) (0 vs. 1 vs. 30 days of abstinence) from rats with extended access to cocaine vs. saline. Unpaired Student’s t-tests per AD time point, *p<0.05. Western blot analysis of H3Q5dop levels in (D) NAc (n = 7/group) or (E) mPFC (n = 6/group) (AD30) from yoked extended access cocaine vs. saline rats (p>0.05). Western blot analysis of H3Q5dop levels in (F) NAc (n = 5–6/group) or (G) mPFC (n = 5–6/group) (AD30) from extended access food (natural reinforcer) vs. non-reinforcement control rats (p>0.05). Total H3 was used as a loading control for all measurements of H3Q5dop, and bar plots represent normalized fold changes comparing cocaine vs. saline or food SA vs. control. Data presented as average ± SEM.
