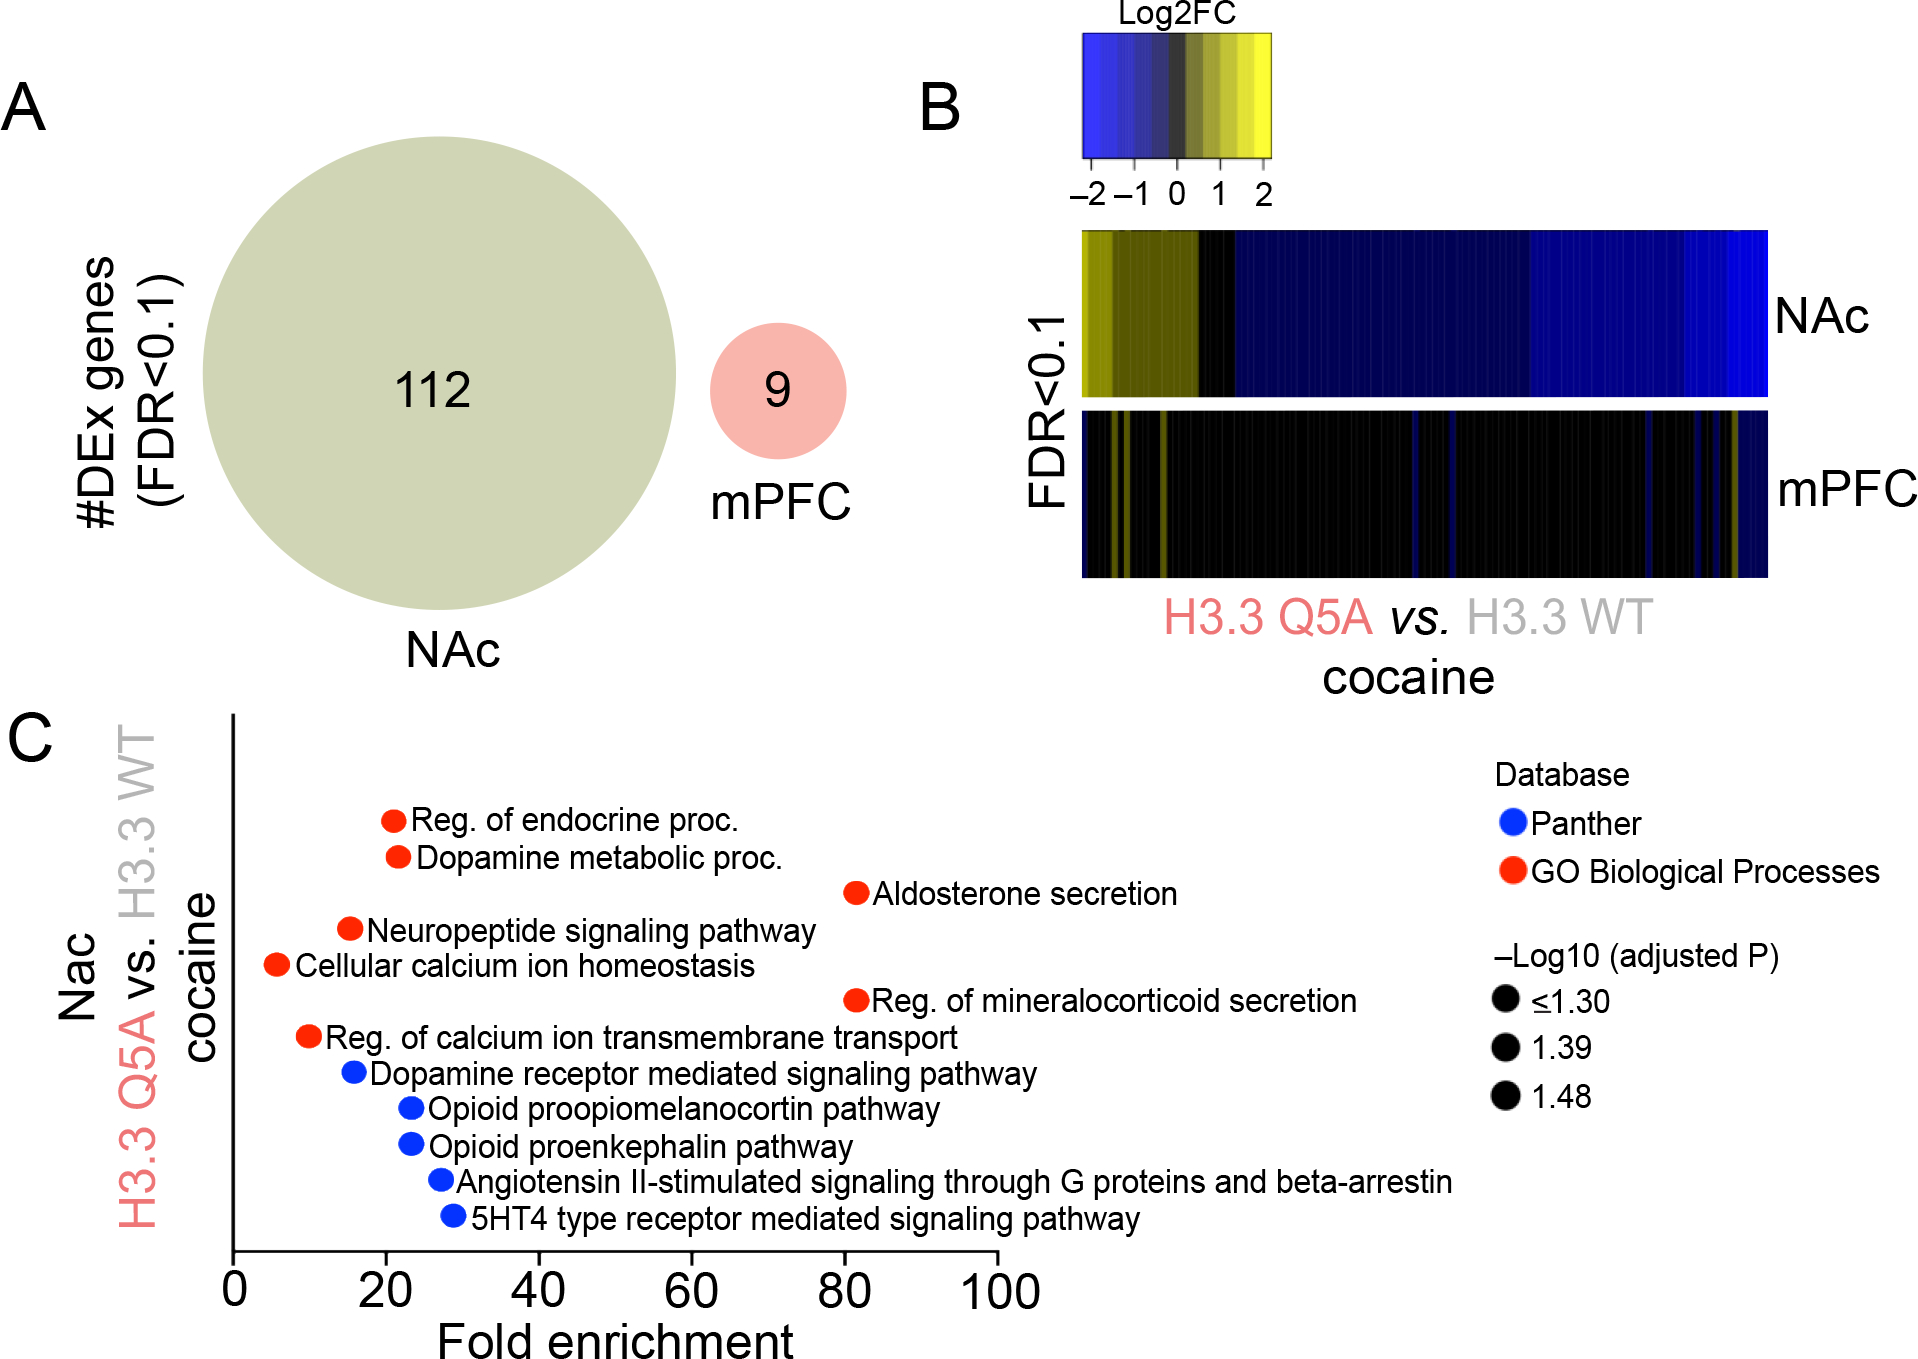
Figure 3. Attenuation of H3Q5dop in NAc, but not mPFC, following cocaine SA regulates gene expression programs associated with drug-induced plasticity.

(A) Venn diagrams depicting the number and degree of overlap of significantly regulated genes (FDR<0.1; n = 6/viral group/brain region) in NAc and mPFC comparing H3.3Q5A vs. H3.3 WT transduced rats following extended access cocaine SA. (B) Heatmaps depicting the Log2 fold-change (FC) of significantly regulated transcripts in NAc and mPFC comparing H3.3Q5A vs. H3.3 WT transduced rats following extended access cocaine SA. (C) Pathway analysis (Panther and GO Biological Process) was performed to assess gene ontology enrichment for differentially expressed genes in NAc comparing H3.3Q5A vs. H3.3 WT transduced rats following extended access cocaine SA.
