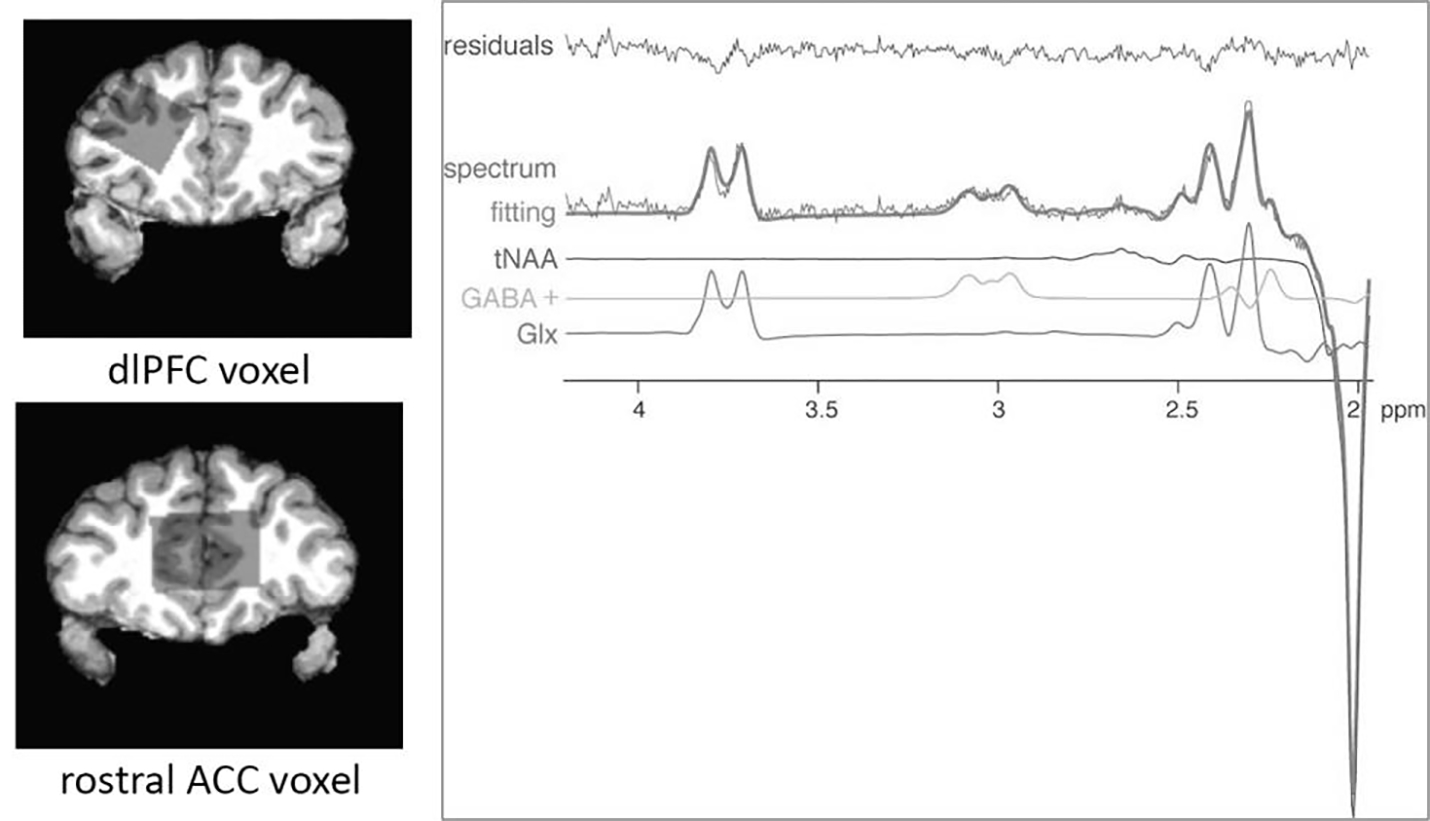
Figure 2.

GABA+-edited (difference) spectrum showing metabolite fitting lines as estimated with LCModel, depicting the GABA+-edited spectrum, fitting line, total N-acetyl aspartate (tNAA), GABA+, glutamate+glutamine (Glx), and residuals. Based on hypotheses specific to GABA, no other metabolites were analyzed in this study.
