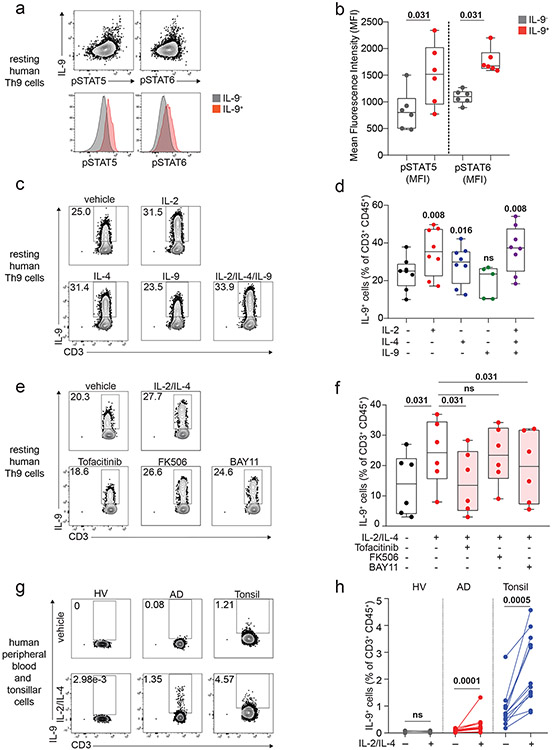
Figure 2. IL-2 and IL-4 rapidly induce bystander activation of resting Th9 cells through STAT5 and STAT6.
a, b. Representative flow plots (a) show pSTAT5, pSTAT6, and IL-9 expression in non-restimulated resting (d8 from start of culture) human cells differentiated from naïve T cells under Th9-promoting conditions (IL-2, IL-4, TGF-β, IL-1β, αIFN-γ). Representative histograms (a) and summary data (b) show mean fluorescence intensity (MFI) of pSTAT5 and pSTAT6 in resting human IL-9+ and IL-9− cells differentiated under Th9-promoting conditions. Bar graphs show pooled results (n = 6). c, d. Representative cytometry plot (c) and summary data (d) show % IL-9+ cells of resting (d8 from start of culture) human Th9 cells restimulated for 6 hours with vehicle, hIL-2 (n = 8), hIL-4 (n = 8),h IL-9 (n = 5), or a combination of the three (n = 8). e, f. Representative flow cytometric plot (e) and summary data (f) show % IL-9+ cells of resting (d8) human Th9 cells restimulated for 6 hours with IL-2 + IL-4 in the presence of vehicle, tofacitinib (JAK-STAT inhibitor), FK506 (calcineurin/NFAT inhibitor), BAY11 (NF-κB inhibitor), or CAY10571 (p38 MAPK inhibitor) (n = 6). g, h. Representative flow cytometric plot (g) and summary data (h) show % IL-9+ cells of circulating memory CD4+ T cells (CD3+/CD4+/CD8−/CD45RO+ cells) stimulated with vehicle vs. IL-2 + IL-4. Cells derive from healthy volunteer peripheral blood mononuclear cells (HV PBMC, n = 6), atopic dermatitis patient PBMC (AD, n = 14), and HV tonsils (n = 12). For all experiments: paired or unpaired t-test, normally distributed data; Wilcoxon (paired) or Mann-Whitney (unpaired), non-normally distributed data. Box plots show all data points (min to max, lines at median). All statistical tests are 2-sided, all replicates are biologically independent samples.

