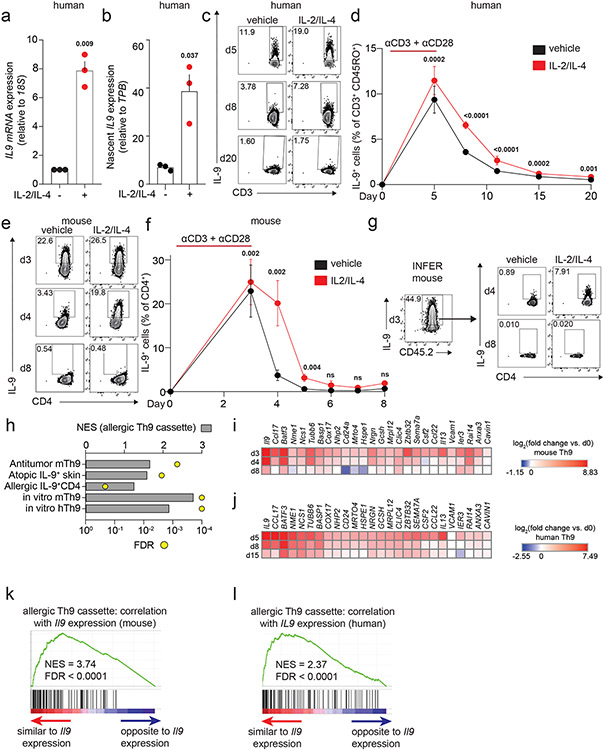
Figure 3. STAT-dependent cytokines induce IL9 transcription in recently activated Th9 cells.
a, b. Graphs show total (a) and nascent (b) IL9 expression in d8 human Th9 cells treated with vehicle or IL-2 + IL-4. (n = 3). c, d. Representative flow plots (c) and graphs (d) show % IL-9+ cells of human Th9 differentiated with αCD3/αCD28 for 5 days then continued with Th9-promoting cytokines/antibodies, but without αCD3/αCD28. On d5 (n = 14), d8/d11 (n = 17), d15 (n = 16), and d20 (n = 11), cells were restimulated with vehicle or IL-2 + IL-4. e, f. Representative flow plots (e) and graphs (f) show % IL-9+ cells of murine Th9 differentiated with αCD3/αCD28 for 3 days, then continued with other Th9-promoting cytokines/antibodies, but without αCD3/αCD28. On d3 (n = 12), d4 (n = 11), d5 (n = 9), d6 (n = 3), d7 (n = 3), and d8 (n = 6), cells were restimulated with vehicle or IL-2 + IL-4. g. Representative flow plots show % IL-9+ cells from IL-9 reporter (INFER) mice. IL-9+ cells were sorted on d3 and maintained in Th9-promoting conditions without αCD3/αCD28. Cells were restimulated on d4 and d8 with vehicle or IL-2 + IL-4. h. Graph shows normalized enrichment score (NES) and false discovery rate (FDR) of Th9 cassette (GSEA) in antitumor Th9 cells; IL9high atopic dermatitis skin; house-dust-mite-stimulated T cells from allergic subjects; d3-murine in vitro differentiated Th9; d5-human in vitro differentiated Th9. i,j. Heatmaps show average fold-change in gene expression of in vitro differentiated murine (n = 3, i) and human (n = 4, j) Th9 cells vs. naïve T cells at various time points, for “allergic Th9” genes with dynamic enrichment (FC > 2, FDR < 0.05) in murine (d3/4 vs. d0/8) and human (d5/8 vs. d0/15) cells. k,l. Enrichment plots show Pearson correlation of “allergic Th9” genes with Il9/IL9 expression over time in murine (k) and human (l) Th9 cells. For all experiments: paired or unpaired t-test, normally distributed data; Wilcoxon (paired) or Mann-Whitney (unpaired), non-normally distributed data. For boxplots/line graphs, error bars show ± SEM. All statistical tests are 2-sided, all replicates are biologically independent samples.

