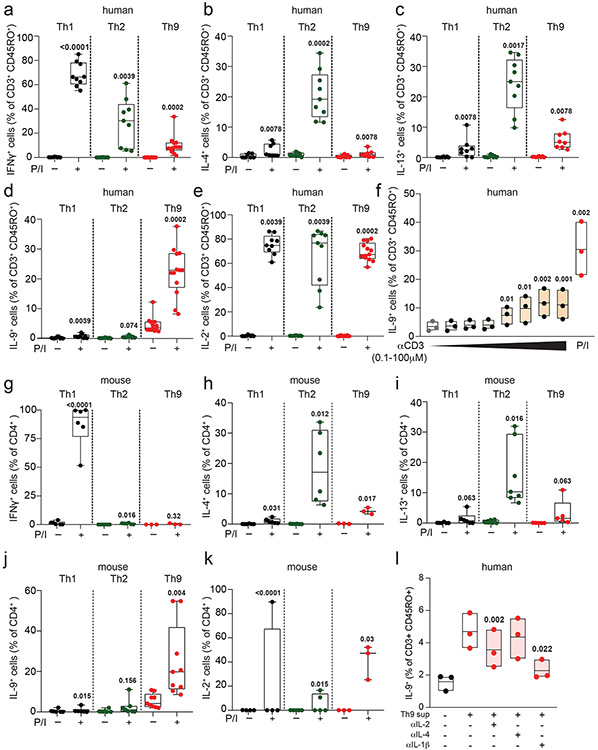
Extended Data Figure 1. Corresponds to Figure 1.
a-e. Naïve CD4+ T cells from healthy volunteers were activated for 5 days with αCD3, αCD28, IL-2, and subset-promoting cytokines and antibodies. After 5 days, αCD3/αCD28 were withdrawn, and cells were cultured with IL-2 and subset-promoting cytokines and antibodies. Pooled results show production of IFN-γ (a), n=9 (Th1, Th2) or 10 (Th9); IL-4 (b), n=8 (Th1), 9 (Th2), or 4 (Th9); IL-13 (c) n=8 (Th1), 9 (Th2), or 4 (Th9); IL-9 (d) n=9 (Th1, Th2), or 10 (Th9); and IL-2 (e) n=9 (Th1, Th2), or 10 (Th9), with or without PMA and Ionomycin (P/I). f. Bar graphs show % IL-9 positive cells differentiated to d8 Th9 as above and restimulated with vehicle vs. plate bound αCD3 at escalating doses (n=3) g-k. Naïve CD4+ T cells from WT C57BL/6 mice were activated for 3 days with αCD3, αCD28, IL-2, and subset-promoting cytokines and antibodies. After 3 days, αCD3/αCD28 were withdrawn, and cells were cultured with IL-2 and subset-promoting cytokines and antibodies. Pooled results show production of IFN-γ (f), n=6 (Th1, Th2) or 3 (Th9); IL-4 (g), n=6 (Th1, Th2) or 5 (Th9); IL-13 (h), n=6 (Th1), 7 (Th2), or 5 (Th9); IL-9 (i), n=6 (Th1), 7 (Th2), or 10 (Th9); and IL-2 (j), n=4 (Th1), 5 (Th2), or 3 (Th9), with or without P/I. l. Bar graphs show % IL-9+ cells of resting (d8) human Th9 cells restimulated with Th9 supernatants and vehicle (n=3), αIL-2 (20 μg/mL), αIL-4 (20 μg/mL), or αIL-1β (20 μg/mL). For all line/bar graphs, error bars show ± S.E.M. Box plots show all data points (min to max, lines at median). For all experiments: paired or unpaired t-test, normally distributed data, Wilcoxon (paired) or Mann-Whitney (unpaired), non-normally distributed data. All statistical tests are 2-sided, all replicates are biologically independent samples.

