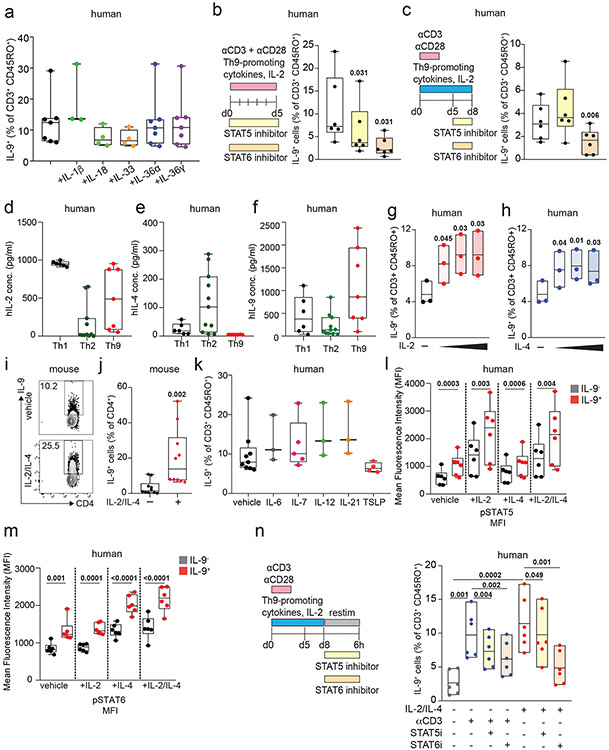
Extended Data Figure 2. Corresponds to Figure 2.
a. Plot shows % IL-9+ of d8 human Th9 cells restimulated with vehicle (n=7), IL-1β (n=3), IL-18 (n=4), IL-33 (n=4), IL-36α (n=7), or IL-36γ (n=7). b-c. Timelines show experimental design; graphs shows % IL-9+ (n=6) for human non-restimulated T cells differentiated as in Fig 1a, with STAT5 inhibitor or STAT6 inhibitor from d0-5 (b) or d5-8 (c). d-f. Box plot shows concentration (pg/mL, ELISA) of IL-2 (d), IL-4 (e), and IL-9 (f) in supernatants of human in vitro differentiated Th1- or Th9 (d5), or Th2 (d14) cells, after 48h restimulation.. g,h. d8 human Th9 cells were restimulated with escalating doses of IL-2 (b) (2, 20, or 200 ng/mL) or IL-4 (c) (6, 60, or 500 ng/mL) (n=3). i,j. Representative flow plots (i) and box plot (j) show % IL-9+ cells in resting (d4) murine Th9 cells restimulated with IL-2 + IL-4 (n=10) k. Box plot shows pooled results d8 human Th9 cells restimulated with vehicle (n=9), IL-6 (n=3), IL-7 (n=5), IL-12 (n=3), IL-21 (n=3), or TSLP (n=4). l, m. Box plots show pooled (n=6) mean fluorescence intensity (MFI) of pSTAT5 (l) and pSTAT6 (m) in d8 human IL-9+ and IL-9− Th9 cells restimulated with IL-2, IL-4, or IL-2 + IL-4. n. Box plots show pooled (n=3) % IL-9+ d8 human Th9 cells stimulated with IL-2 and IL-4 in the presence of STAT5 or STAT6 inhibitor. For all experiments: paired or unpaired t-test, normally distributed data; Wilcoxon (paired) or Mann-Whitney (unpaired), non-normally distributed data. Box plots show all data points (min to max, lines at median). All statistical tests are 2-sided, all replicates are biologically independent samples.

