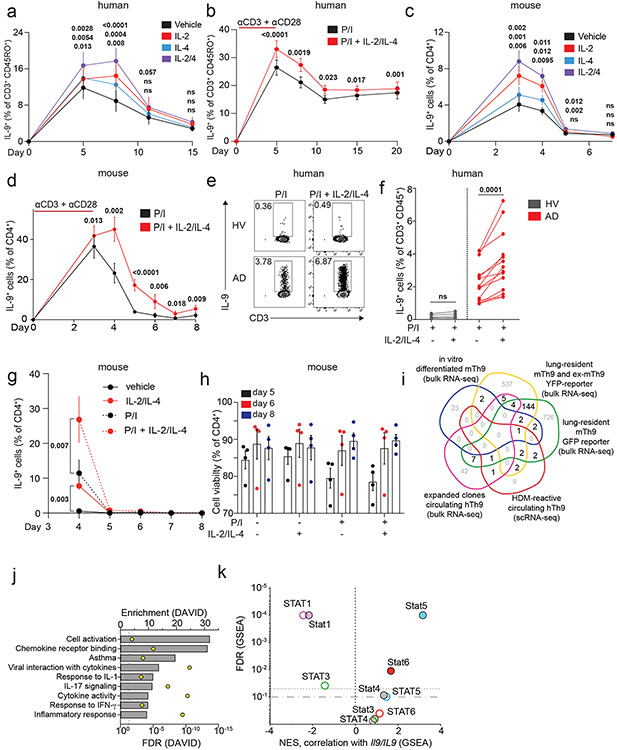
Extended Data Figure 3. Corresponds to Figure 3.
a b. Line graph shows % IL-9+ cells of human Th9 differentiated as in Fig 1a. Cells were restimulated with vehicle, IL-2, IL-4, or IL-2 + IL-4 (a, n=6); b. on d5 (n=14), d8/d11 (n=17), d15 (n=16), and d20 (n=11), cells were restimulated with PMA + ionomycin (P/I) or P/I + IL-2 + IL-4. c,d. Line graph shows % IL-9+ cells of murine Th9 differentiated as in Fig 1d. Cells were restimulated with vehicle, IL-2, IL-4, or IL-2 + IL-4 (c, n=4). d. On d3 (n=12), d4 (n=11), d5 (n=9), d6 (n=3), d7 (n=3), and d8 (n=6), cells were restimulated P/I or P/I + IL-2 + IL-4. e, f. Representative flow plots (e) and graphs (f) show % IL-9+ of circulating Th9 cells stimulated with P/I or P/I + IL-2 + IL-4, from healthy volunteer (HV, n=5) or atopic patients (AD, n=14). g. Line graphs shows pooled results (n=5) for % IL-9+ cells from IL-9 reporter (INFER) mice, sorted on d3 and maintained as in Fig 1d. Cells were restimulated with vehicle, IL-2 + IL-4, P/I or P/I + IL-2 + IL-4, p-value is for d4. h. Bar graphs show viability (n=4) for Th9 cells. i. Venn diagram shows generation of “allergic Th9” cassette using: HDM-reactive circulating Th9 cells from allergic patients1, Th9 clones from healthy subjects2, pulmonary Th9 cells from IL-9 reporter mice, and in vitro differentiated Th9 cells3. Genes differentially expressed in >1 dataset were selected. j. Bar graph shows pathway enrichment scores and false discovery rates (FDR, DAVID) for the “allergic Th9” cassette. k. Scatterplot shows enrichment score (GSEA) and FDR for correlation (Pearson) of STAT1, STAT3, STAT4, STAT5, and STAT6 target genes with murine Il9 expression and human IL9 expression. For all experiments: paired or unpaired t-test, normally distributed data; Wilcoxon (paired) or Mann-Whitney (unpaired), non-normally distributed data. Bar/line graphs show mean ± SEM; box plots show all data points (min to max, lines at median). All statistical tests are 2-sided, all replicates are biologically independent samples.

