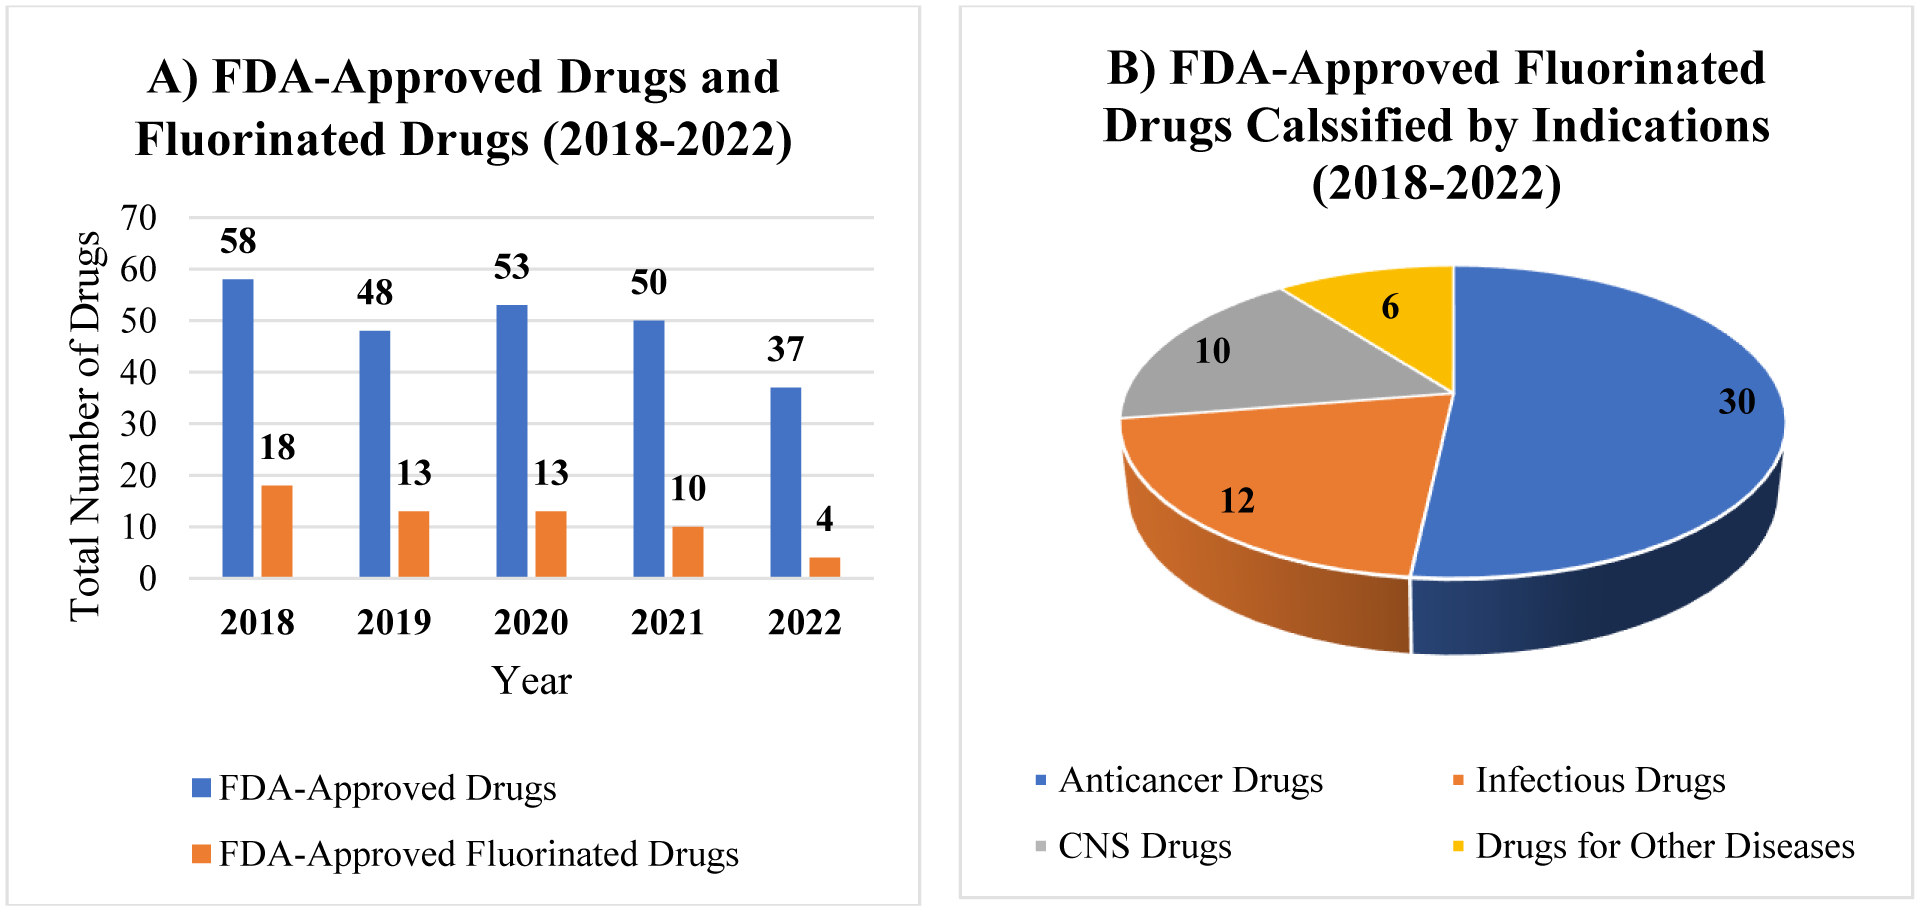
Fig. 2.

A) Bar graph illustration of U.S. FDA-approved total numbers of drugs and fluorinated drugs from 2018 to 2022; B) Pie chart presents the numbers of fluorinated drugs approved by FDA from 2018 to 2022 classified by indications such as cancers, CNS disorders, infections, and some other diseases. The source of the data is the U.S. FDA Web site [51].
