
Figure 1: Severe CD8+ T cell lymphopenia in WHIM patients and WHIM model mice.
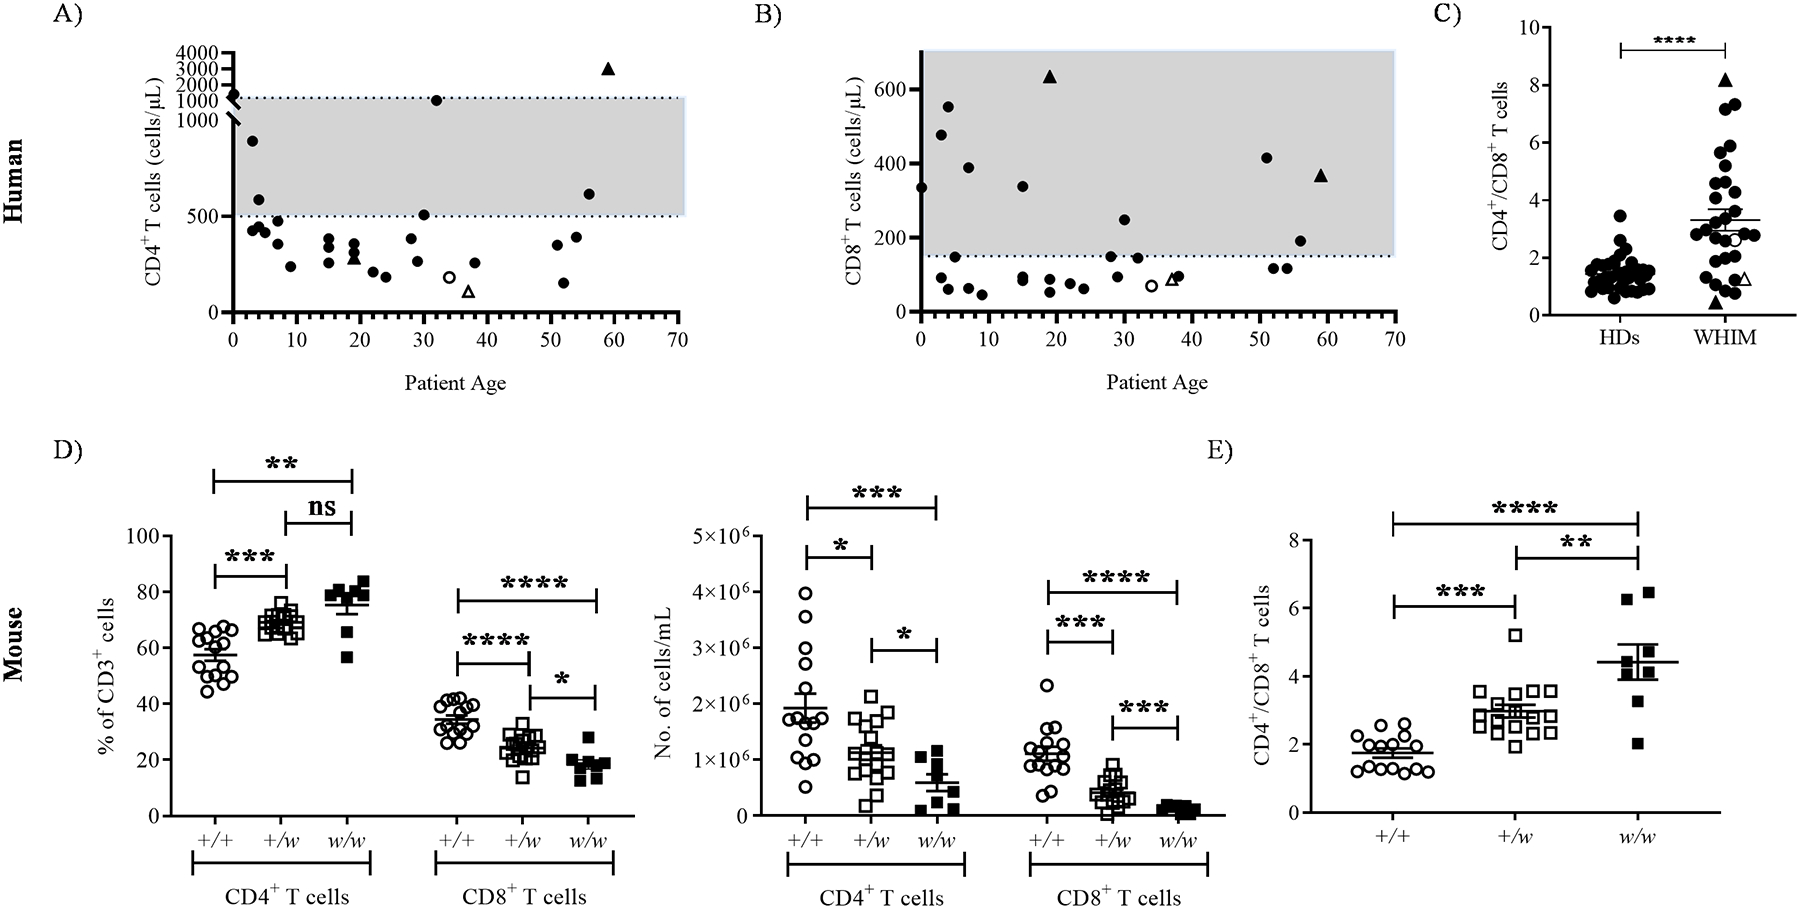
Circulating T lymphocytes were analyzed at the first visit of WHIM patients to the NIH, when they were not receiving cell-mobilizing agents and showed no signs of active infection. A and B) T cell lymphopenia in NIH WHIM patients. Absolute numbers of the indicated T cell subsets were plotted as a function of patient age at presentation to the NIH. C) CD4/CD8 ratios in WHIM patients. The ratios were calculated from the source data in panels A and B. The WHIM patients included 18 females and 12 males, with a median age of 23.8 years (ranging from neonates to 59 years). Healthy donor (HD) data in C were derived from 21 female and 16 male NIH blood donors, with a median age of 46 years (ranging from 22–68 years). Upright triangle symbols designate patients who had had splenectomy and unfilled symbols designate patients carrying the CXCR4 S338X mutation. The shaded gray areas in the graphs A and B are normal ranges for adults at the NIH Clinical Center Department of Laboratory Medicine. D) T cell lymphopenia in 5–8 week old WHIM mice. CD4+ and CD8+ T cell subset frequency in the CD3+ gate (left panel) and total counts (right panel) in the blood. E) CD4/CD8 ratios in blood calculated from the data in panel D. In D and E, mouse Cxcr4 genotypes (+, wild type allele; w, WHIM knockin allele) are shown on the x-axes, and each dot corresponds to data from one mouse from at least 8 mice per genotype from 8 independent experiments. Data in panels C-E are the mean ± SEM. ns, not significant; *, p< 0.05, **, p< 0.01, ***, p< 0.001 and ****, p< 0.0001 as determined by the two-tailed unpaired t test for C and one-way ANOVA for D and E.