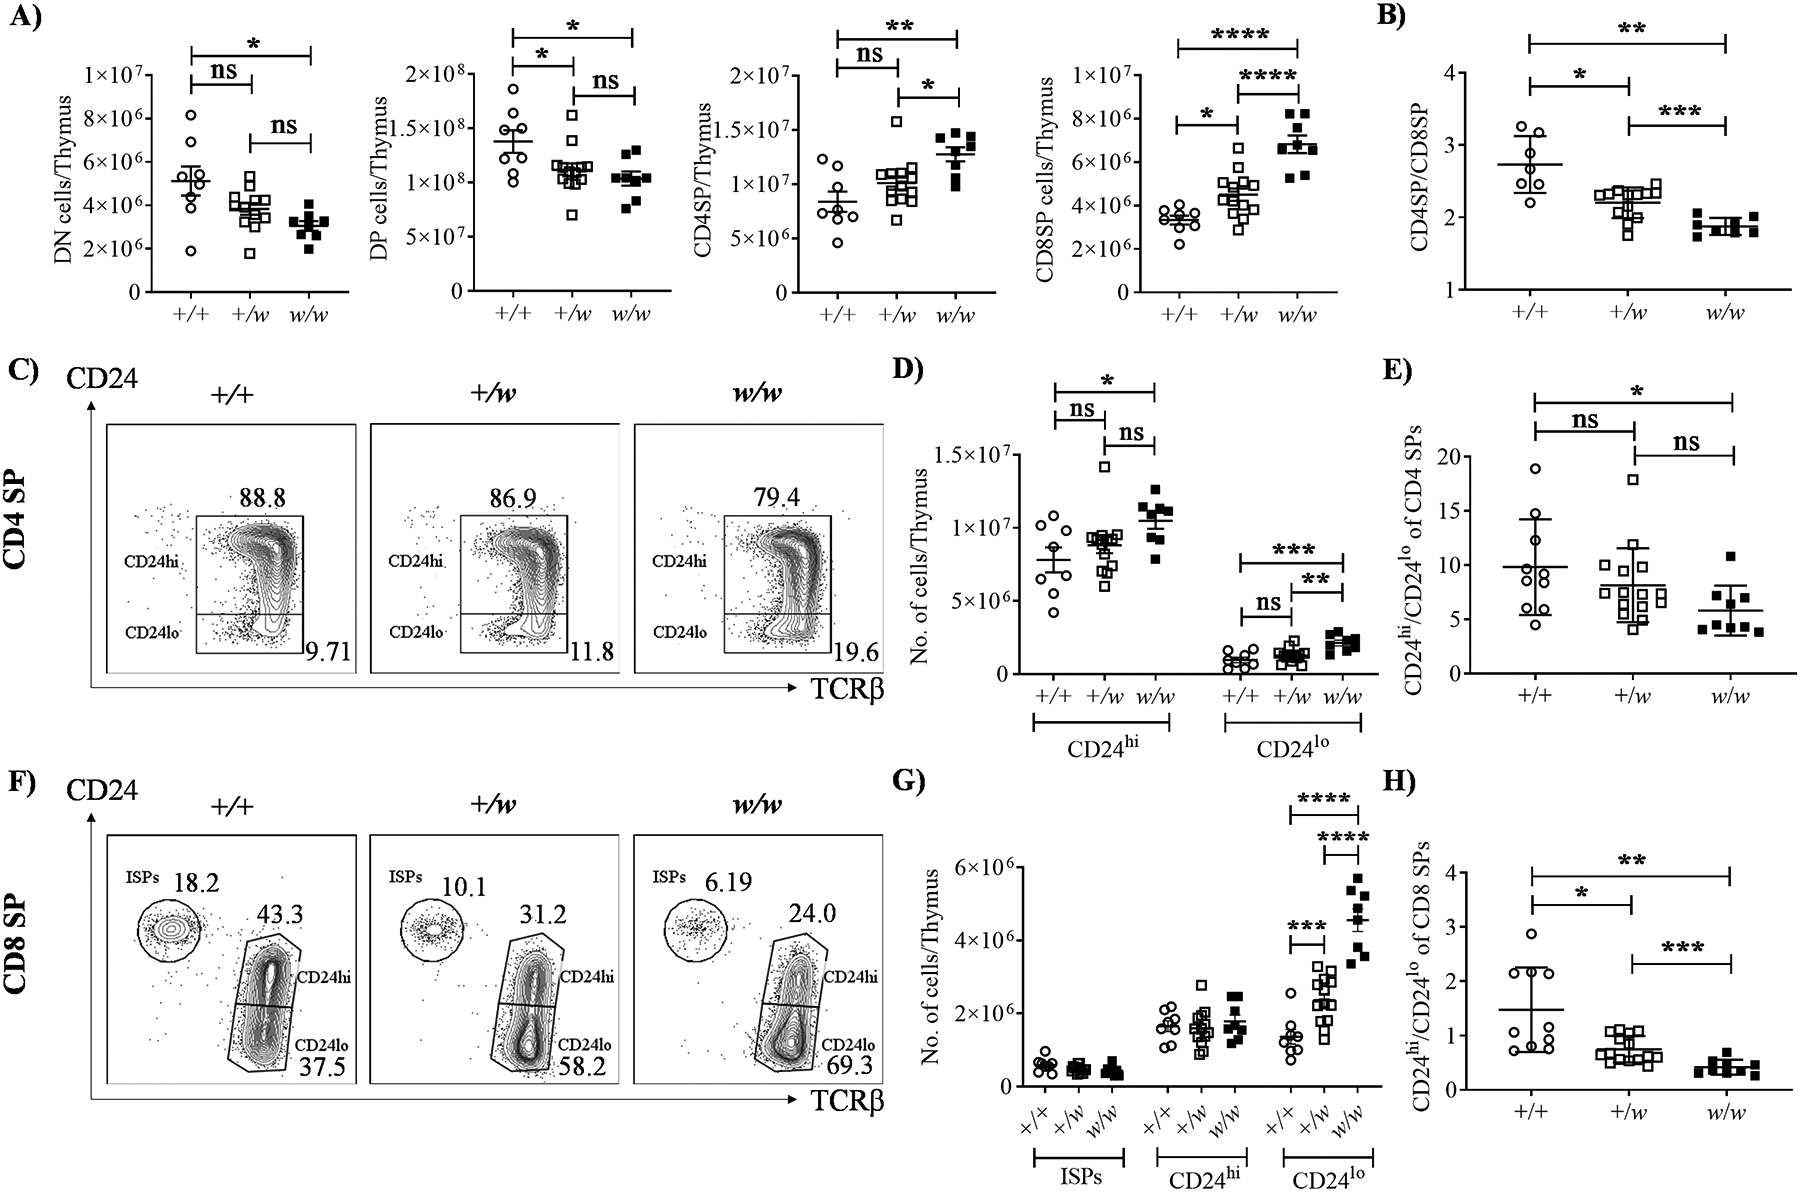
Figure 2: Accumulation of CD8 SP thymocytes in WHIM mice results from selective increase of mature CD24loCD8 SP cells.

5–8 week old mice were sacrificed, thymi were harvested, and thymocytes were analyzed by flow cytometry. A) Thymocyte subset analysis by CD4 and CD8 expression. Summary data are shown for the absolute numbers of thymocyte subsets. B) CD4/CD8 ratios. C-H) SP subset analysis by CD24 and TCRβ expression. C-E) Analysis of CD4 SP. F-H) Analysis of CD8 SP. C and F) Representative contour-plots for CD4 and CD8 SP cells, respectively. Cxcr4 genotypes (+, wild type allele; w, WHIM allele) are indicated at the top of each plot. ISP, immature CD8 single positive cells (CD24hiTCRβlo). The subset names and frequencies are adjacent to each gate. In D and G, the immature single positives (ISPs, CD24hiTCRβlo), CD24hiTCRβhi (semi-mature) and CD24loTCRβhi (mature) cells were gated and their absolute counts per thymus are summarized for all mice tested. The ratios of CD24hi/CD24lo cells in the CD4 SP and CD8 SP compartments were also calculated (E and H). The Cxcr4 genotypes of the mouse groups in A, B, D, E, G and H are indicated on the x-axes. Each dot corresponds to data from one mouse. Data are summarized as the mean ± SEM of at least 7 mice per genotype from 4 independent experiments. ns, not significant; *, p< 0.05, **, p< 0.01, ***, p< 0.001 and ****, p< 0.0001 as determined by the one-way ANOVA for all the data sets.
