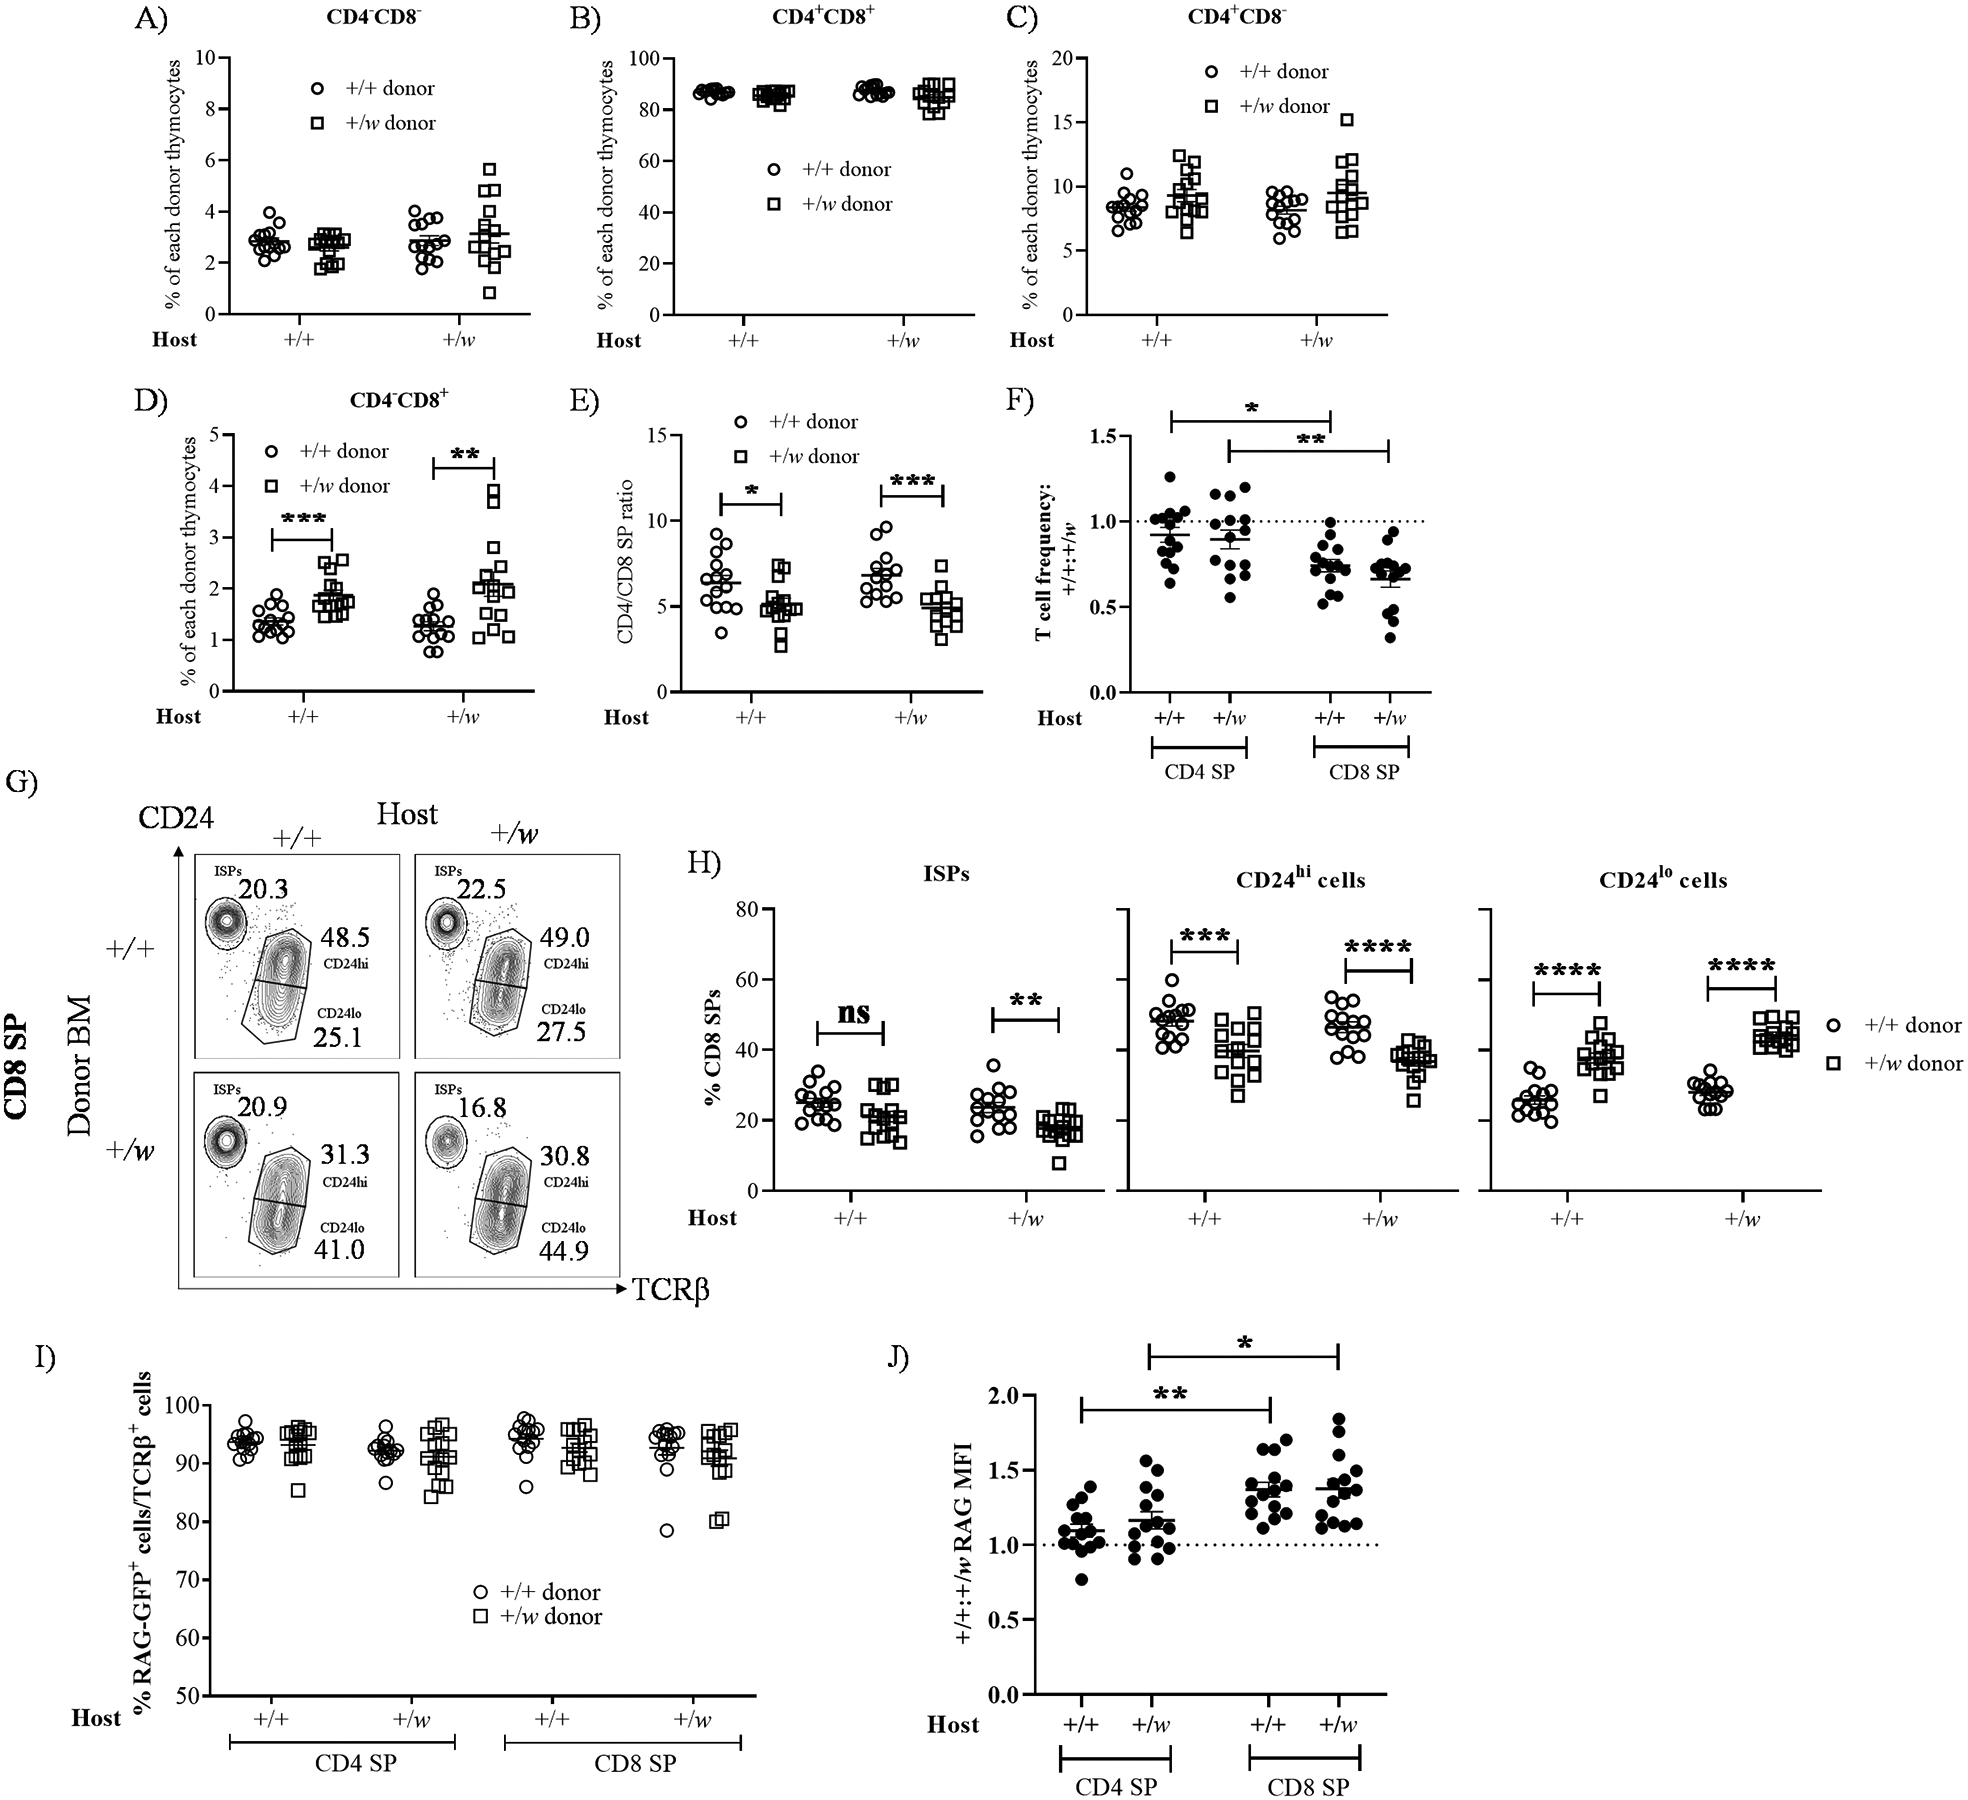
Figure 3: Accumulation of WHIM CD8 SP thymocytes in the thymus is cell-intrinsic and associated with prolonged thymic residence.

Approximately 6-week-old male and female CD45.1/.2 +/+ and CD45.2 +/w mice transgenic for RAG-GFP were sacrificed, and their BM cells were harvested. After T cell depletion, the +/+ and +/w BM cells were mixed at a 1:1 ratio and injected i.v. into lethally irradiated CD45.1/.2 +/+ and CD45.1/.2 +/w recipient mice (not expressing RAG-GFP). 8–10 weeks after transplantation, thymi were harvested and the proportions of major thymocyte subsets were quantified by FACS analysis for the subsets indicated above each graph in A-D. E) CD4/CD8 SP ratios. Ratios were calculated from data in panels C and D. In A-E, the Cxcr4 genotypes for the donor-derived thymocytes and host groups are indicated in the insets and on the x-axes, respectively. F) +/+/ to +/w SP ratios for the SP cells and host groups indicated on the x-axis. G and H) The WHIM mutation promotes accumulation of mature CD24loCD8 SP donor cells in the thymus. G) Representative contour-plots for the CD24 and TCRβ staining of CD8 SP cells. The recipient and donor Cxcr4 genotypes (+, wild type Cxcr4; w, WHIM allele) are designated for each graph column and row, respectively; ISP, immature single positive cells (CD24hiTCRβlo). The subset names and frequencies are adjacent to each gate. H) Summary data for ISPs, CD24hi and CD24lo CD8 SP subsets, respectively. The Cxcr4 genotypes of the donor cells are given in the legend on the right. I and J) Prolonged thymic residence time of mature +/w CD24loCD8 SPs. The proportions of RAG-GFP-positive CD4 and CD8 SP TCRβ+ thymocytes were quantified in I. The Cxcr4 genotypes of the donor cells are given in the inset. J) Donor +/+ to +/w ratios of the geometric mean fluorescence intensity (MFI) of RAG-GFP expression for the SP subsets and hosts indicated on the x-axis. Data are summarized as the mean ± SEM of 16 mice per genotype from 7 independent experiments. *, p< 0.05, ****, p< 0.01, ***, p< 0.001 and ****, p< 0.0001, as determined by multiple t-tests for panels D, E and H, and the one-way ANOVA for panels F and J.
