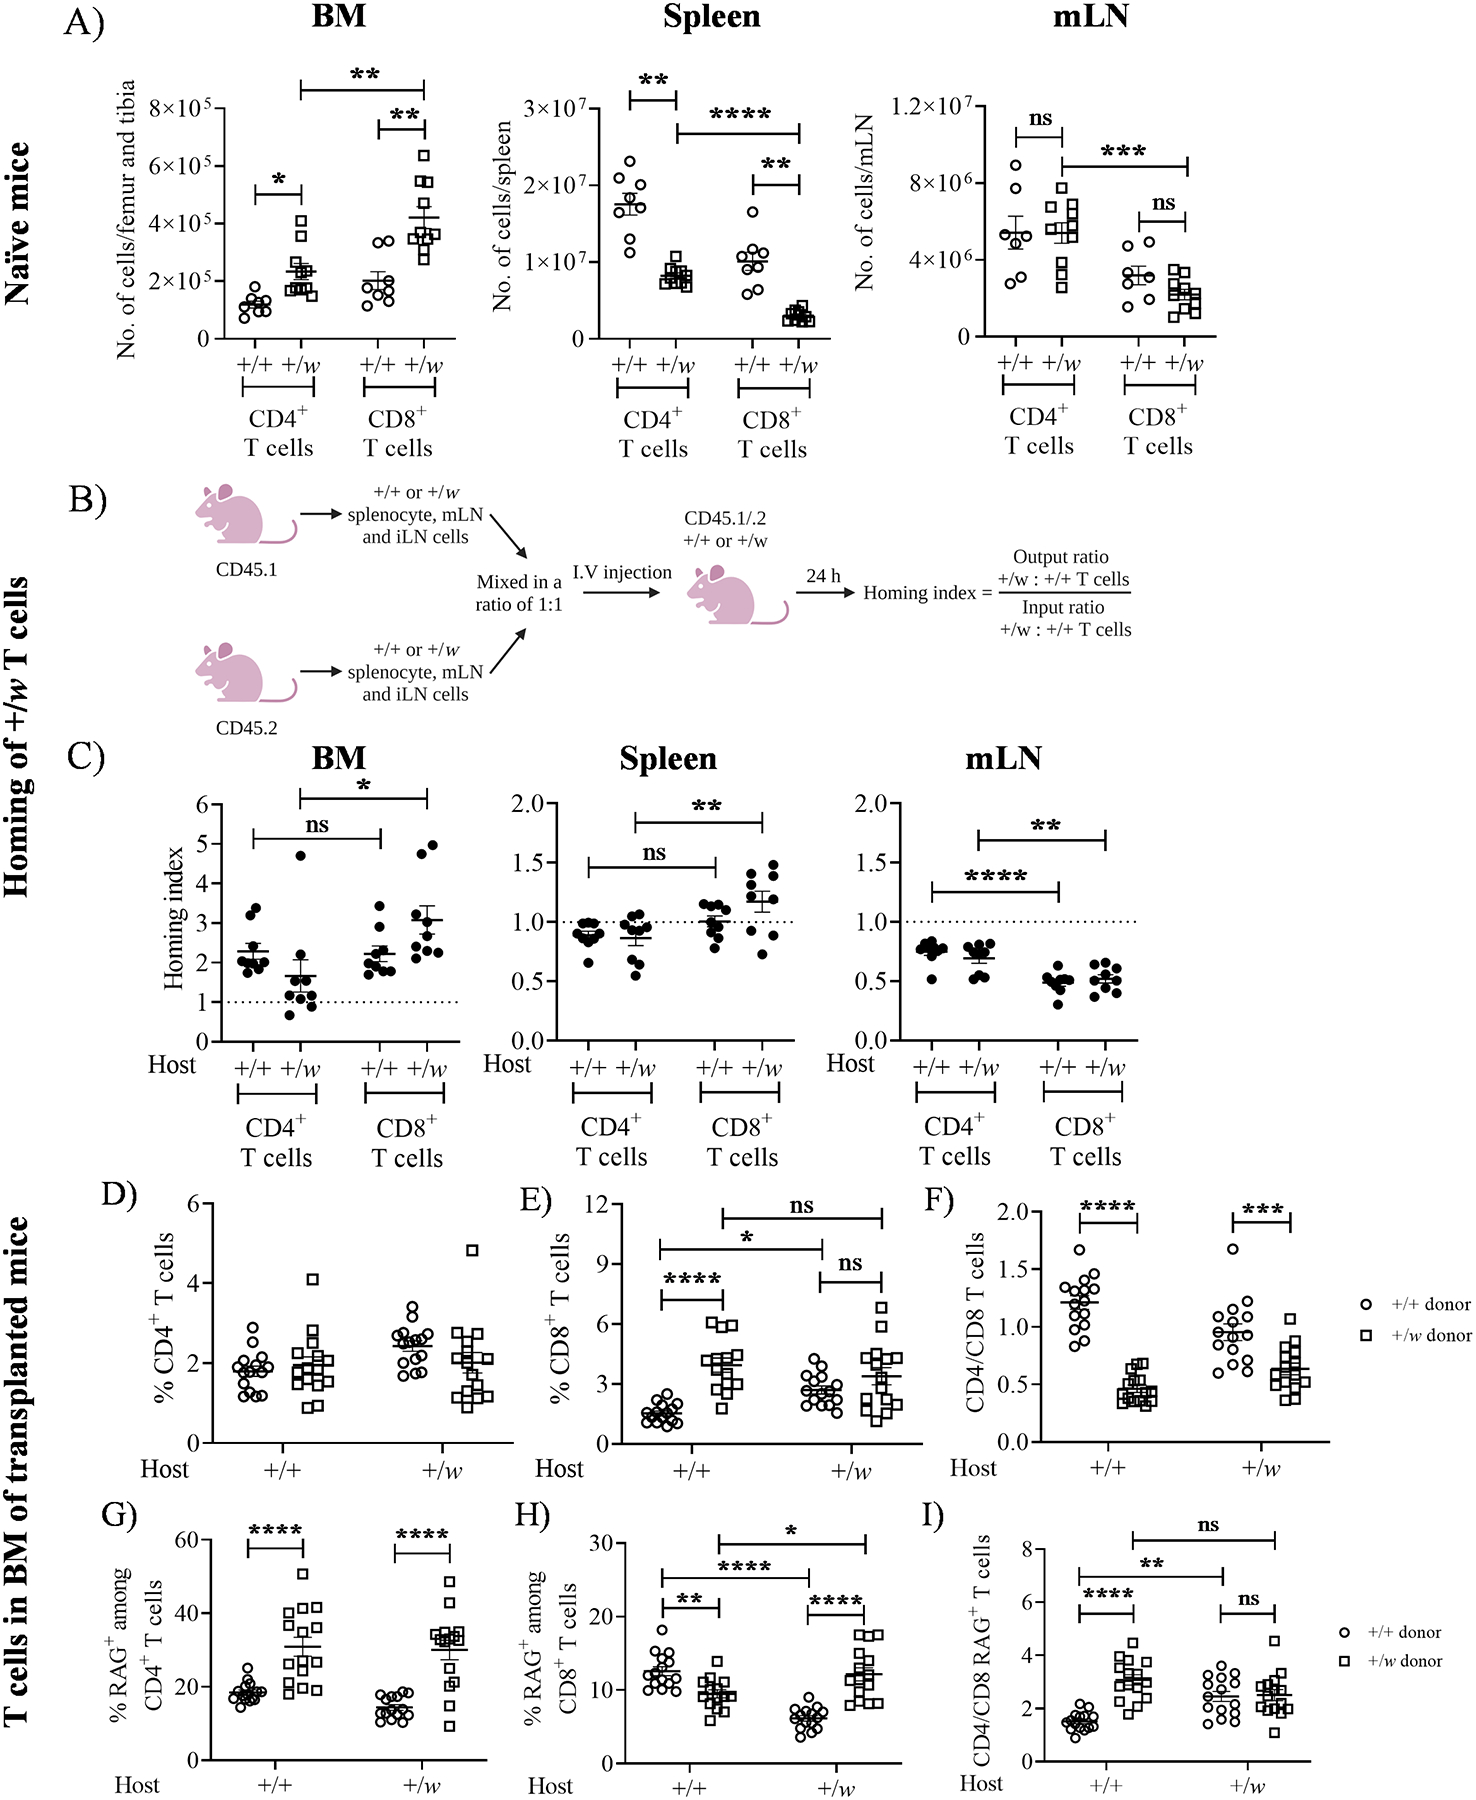
Figure 5: WHIM CXCR4 enhances T cell residence in the BM.

A) Higher T cell content in the BM of +/w mice. 5–8 weeks-old +/+ and +/w mice were sacrificed, their BM, spleen and mesenteric lymph node (mLN) were harvested and the organs were processed to quantify the T cell content. For panel A, data from 4 independent experiments consisting of at least 8 mice/genotype are summarized. The Cxcr4 genotypes of the mice are given on the x-axes of the graphs. (B and C) +/w CXCR4 enhances T cell entry into the BM. B) Experimental protocol for quantification of T cell homing index. CD45 isoform-marked cells from spleen, mLN and iLN of 8–12 weeks-old +/+ and +/w mice were harvested and processed. The +/+ and +/w cells were mixed in a ratio of 1:1 and injected i.v. into CD45.1/.2 +/+ and +/w mice. After 24 h of adoptive transfer, organs in the host mice were harvested to quantify the donor T cell content. (C) Homing capacity of +/w T cells. The samples indicated on the top of each panel were harvested and stained to quantify the T cell content. The Cxcr4 genotypes of the recipient mice are given on the x-axis of each panel. Data are summarized as the mean ± SEM of 8–9 mice per genotype from 3 independent experiments. (D-I) +/w CD8+ T cells accumulate in the BM in a cell-intrinsic manner. T-cell depleted CD45.1/.2 +/+ and CD45.2 +/w BM expressing RAG-GFP were mixed in a ratio of 1:1 and injected i.v. into lethally irradiated CD45.1/.2 +/+ and +/w recipient mice (not expressing RAG-GFP). After 8–10 weeks of BM reconstitution, the femurs and tibias were harvested and T cells in the BM were studied. Total donor CD4+ (D) and CD8+ (E) T cells were quantified as percentages of total CD45+ cells, which were then used to calculate donor-specific CD4/CD8 ratios (F). The RAG-GFP+ cells among donor CD4+ T cells (G) and donor CD8+ T cells (H) were also quantified as a percentage of CD4+ and CD8+ cells, respectively, which were then used to calculate the corresponding CD4/CD8 ratios (I). The Cxcr4 genotypes of the recipient mice are indicated on the x-axes. The Cxcr4 genotypes of the donor-derived T cells are given in the legends on the right side of panels F and I. Data are summarized as the mean ± SEM of 16 mice per genotype from 7 independent experiments. ns: not significant, *, p< 0.05, **, p< 0.01 and *** p< 0.001, ****, p< 0.0001 as determined by the one-way ANOVA for A and C and two-way ANOVA for D-I.
