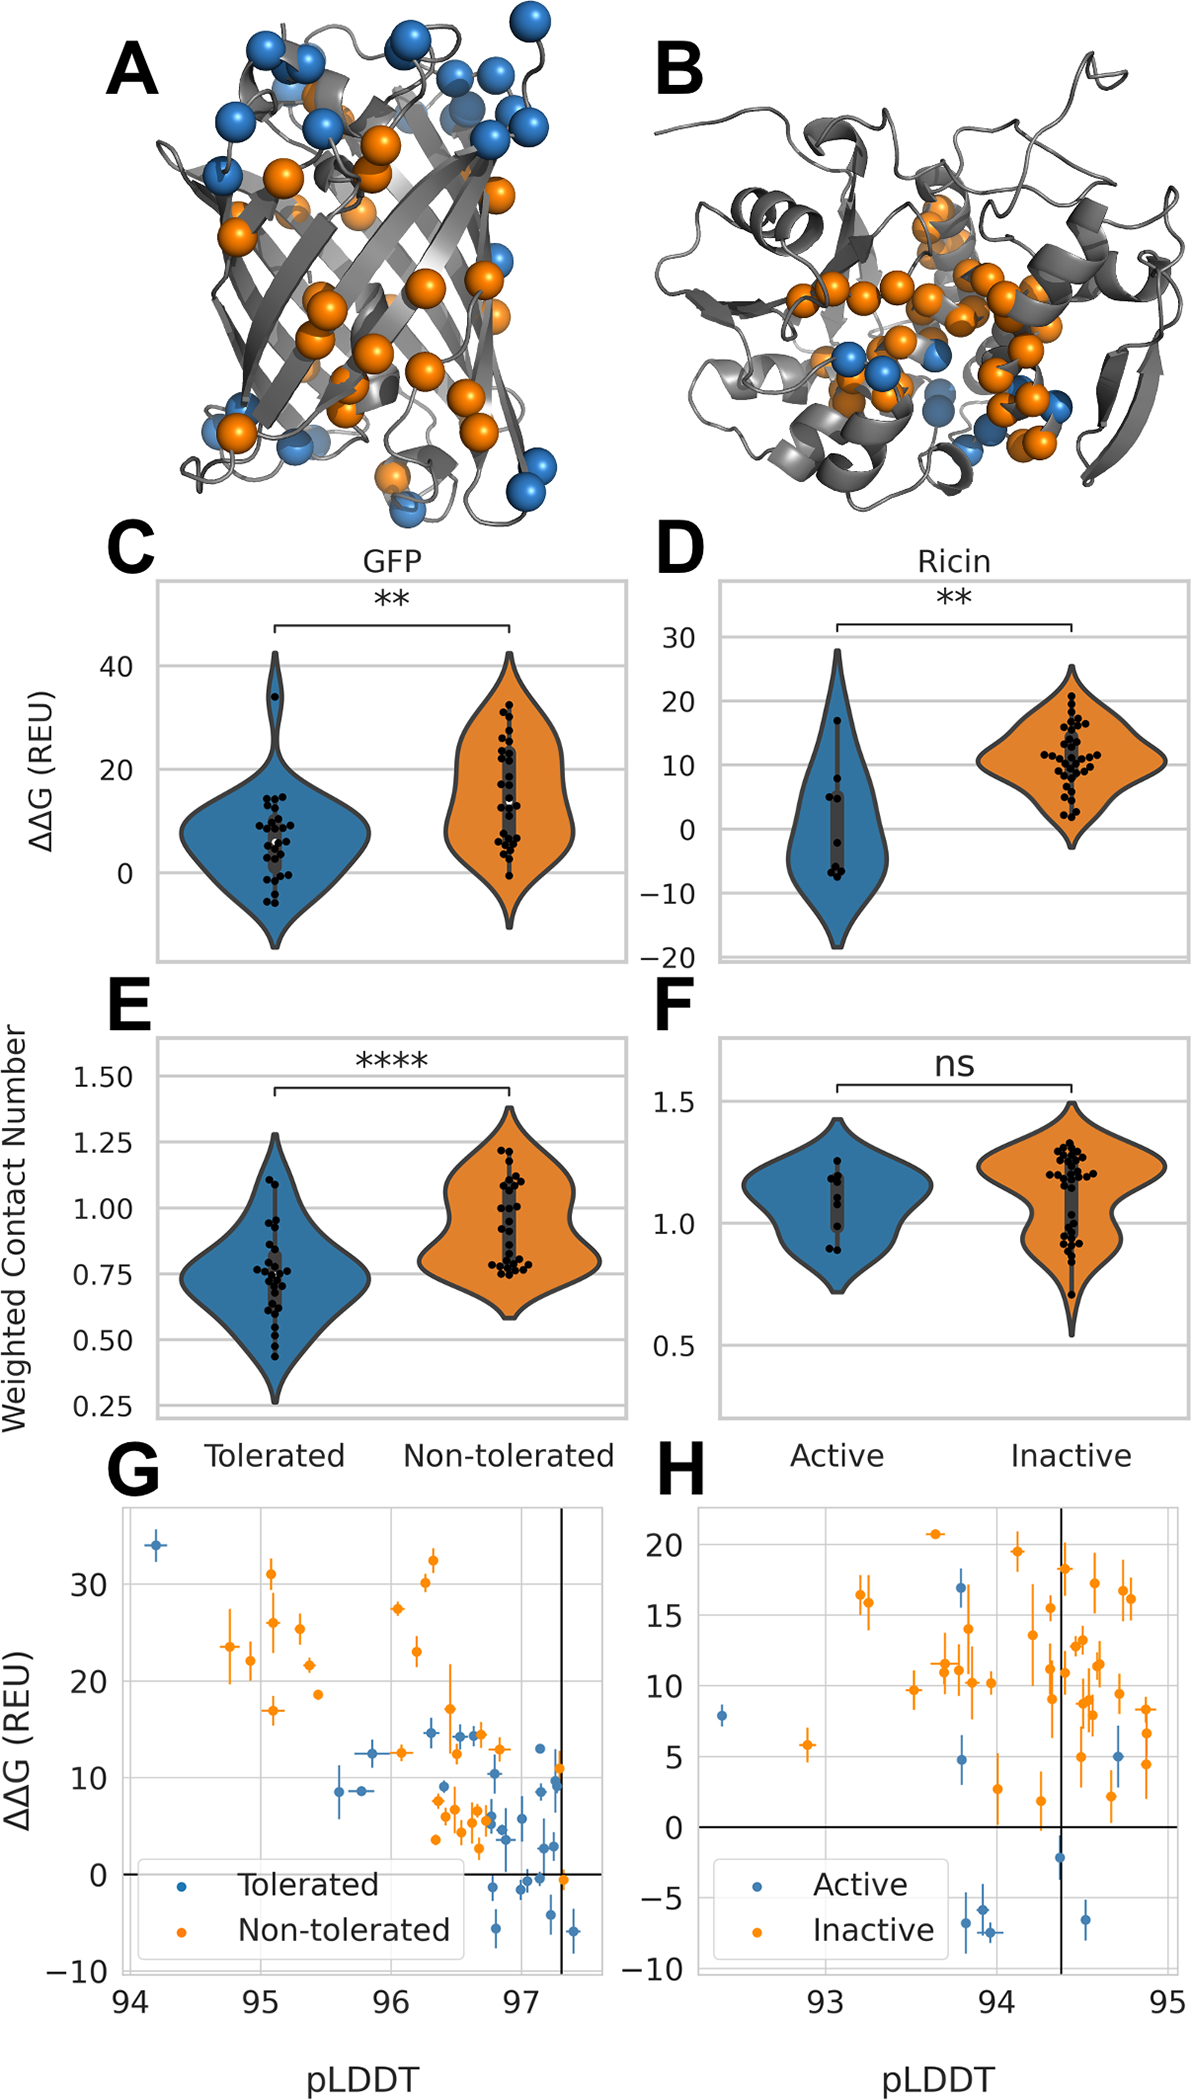
Figure 5: Performance of computational protocols on GFP and Ricin dataset.

A. Tolerated deletion mutations in blue and non-tolerated in orange mapped on GFP structure17; B. Deletion mutants with remaining Ricin activity in orange and deletion mutations without activity in blue21,23; C. Distribution of ΔΔG values from AlphaFold2-RosettaRelax protocol from tolerated and non-tolerated deletion mutants in GFP; stars indicate p-values calculated from Mann-Whitney test with a p-value of 2.12×10³ and D. for Ricin with a p-value of 1.8×10³. E. Distribution of WCN for tolerated and non-tolerated deletion mutations in GFP with a p-value of 6.84×10⁵ and F. in Ricin with a p-value of 0.26. G. ΔΔG values plotted against average pLDDT values from AlphaFold2 for GFP and H. for Ricin. Black lines represent values obtained for GFP and Ricin wildtype respectively. Error bars depict standard error.
