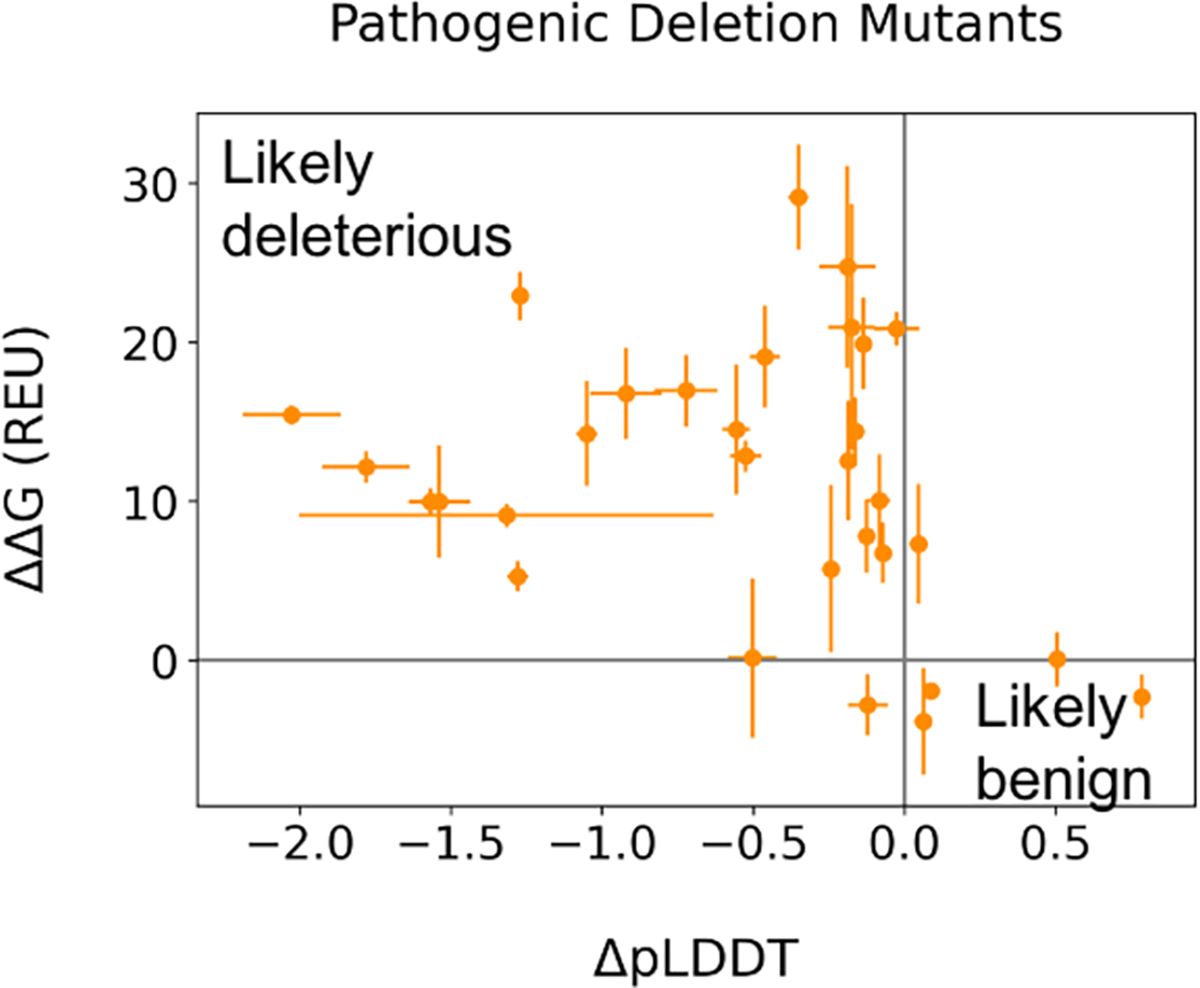
Figure 6: Modeling known pathogenic deletion mutants.

Average ΔpLDDT values from AlphaFold2 versus ΔΔG from AlphaFold+RosettaRelax for pathogenic deletion mutations listed in Table S4. Gray lines drawn at 0 to indicate how far from the wildtype value each mutant is. Error bars depict standard error.
