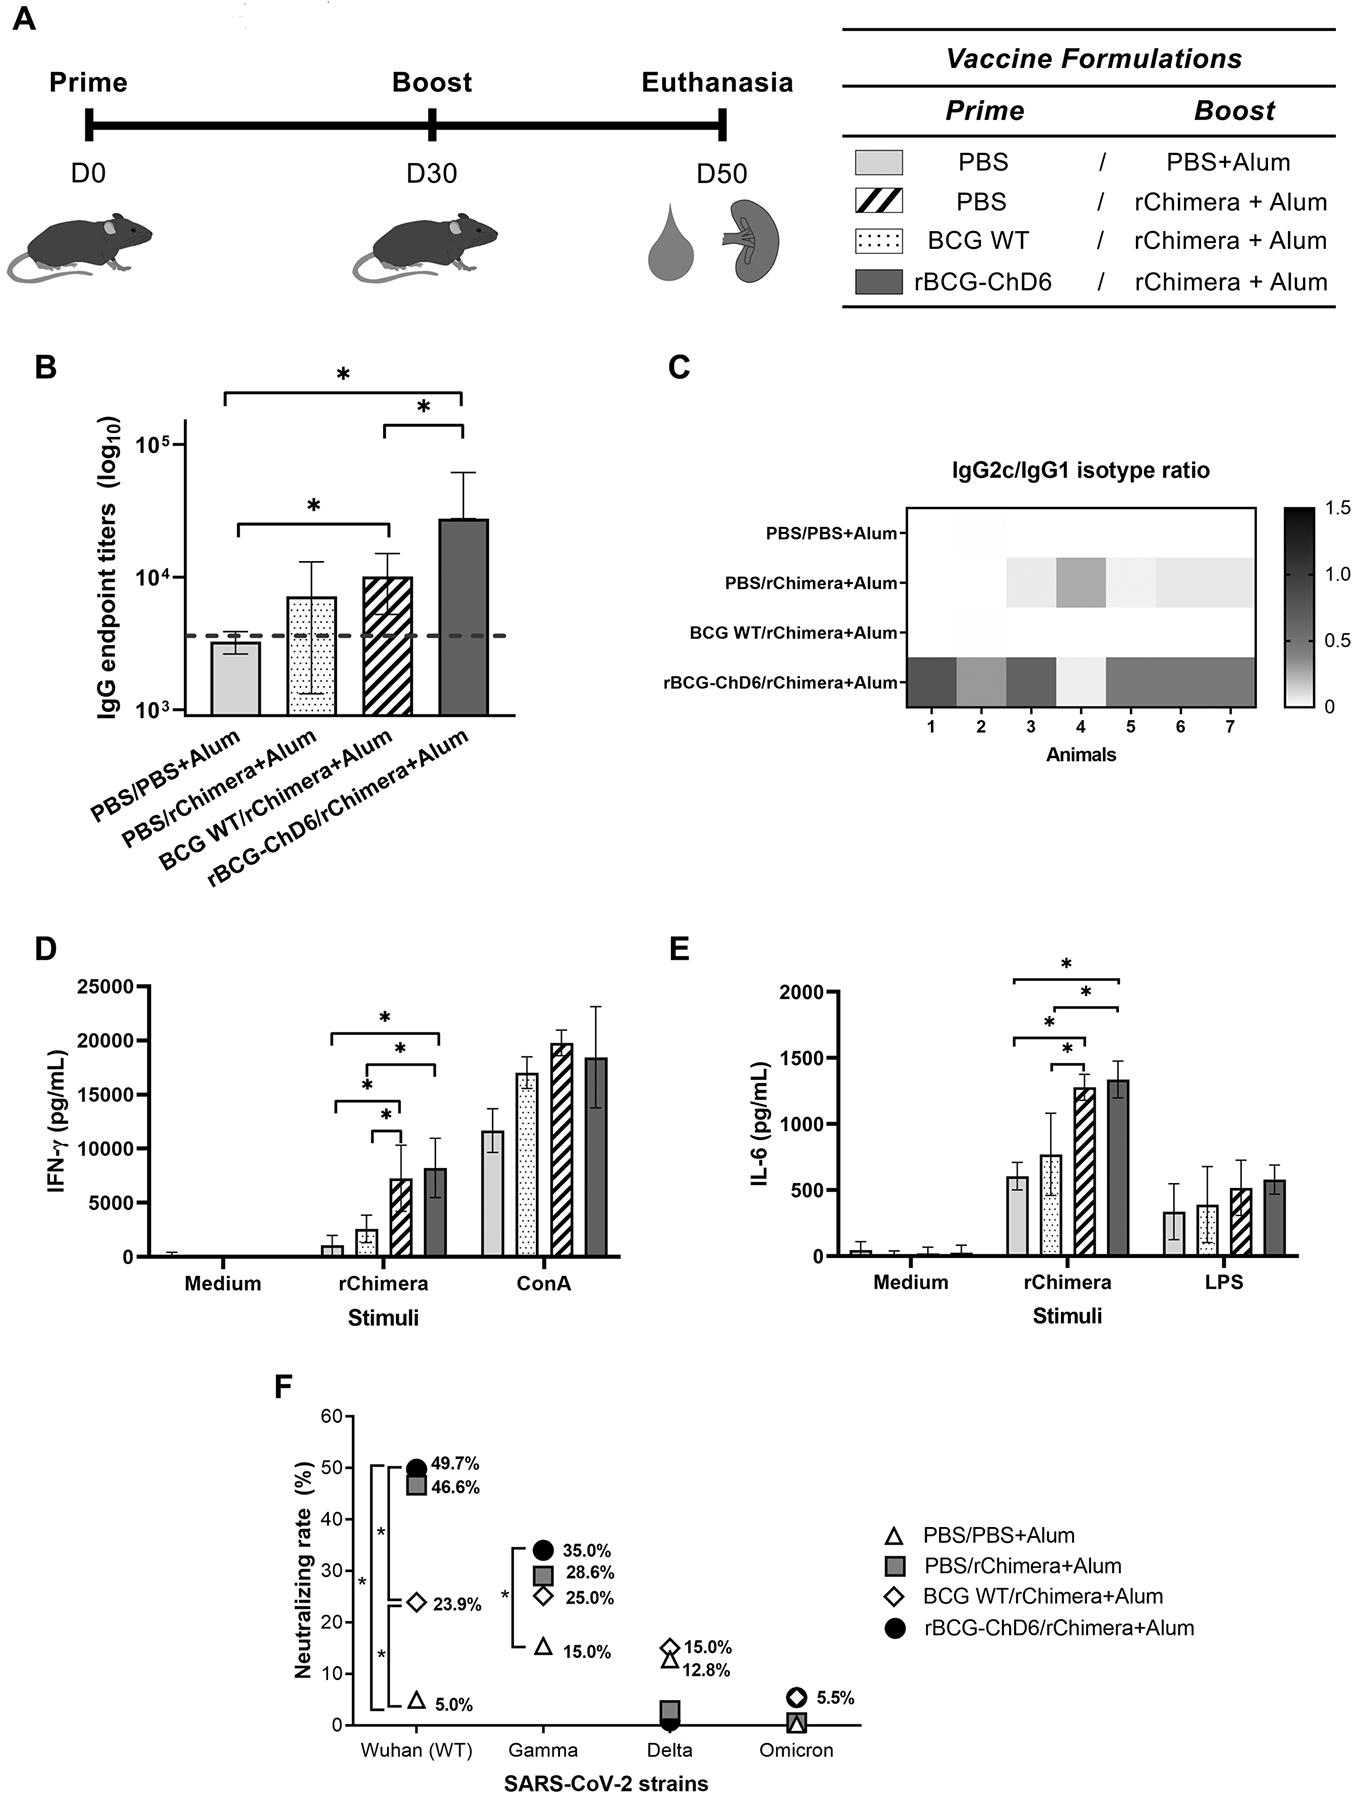
Figure 4. Immunization of K18-hACE2 mice with rBCG-ChD6 and boosted with rChimera protein induces IgG and IgG2c/IgG1 isotype responses, neutralizing antibodies, IFN-γ and IL-6 production.

A) Schematic representation of K18-hACE2 mice vaccination. Mice (n = 5–7 mice) were immunized at day 0 with PBS, BCG WT or rBCG-ChD6 (s.c.). At day 30, mice were boosted with formulations containing rChimera+Alum or PBS+Alum. At day 50, blood was collected and spleens were harvested. Immunization groups are indicated next to the vaccination schedule. Sera collected at day 50 were used to determine antibodies against rChimera by ELISA. B) Sera was diluted serially and IgG endpoint-titers were determined by ELISA. The dilution of each sample that reached the average of the control sera (± 2 standard deviation units) was represented in bars by mean ± S.D and the dotted line indicates the limit of detection. C) Sera diluted 1:100 were assayed for IgG1 and IgG2c antibody isotype determination against rChimera. IgG2c/IgG1 ratio is represented by the heatmap and the color scale ranges from 0.0 in black to 1.5 in white, indicating the IgG2c/IgG1 ratio of detected absorbances. D-E) Spleens were harvested 20 days after booster dose. Culture cell supernatant was assayed for (D) IFN-γ and (E) IL-6 cytokine productions in response to stimulation with rChimera, LPS or ConcanavalinA. Bars represent mean cytokine concentration ± SD for each group. F) Neutralizing rates were assessed by incubating the mice sera for one hour with an HIV-1-based pseudovirus at different dilutions. Pseudovirus-sera solutions were used to infect 293T/ACE2 cells in 96-well plate and NanoLuc (RLU) activity was detected. The neutralization rate against wildtype and variant viruses is obtained by the formula described in the methods section and final results are plotted as the observed percentage of neutralization. Statistical analyses were performed using 1-way ANOVA (for B and F) and 2-way ANOVA (for D and E) followed by the Bonferroni post-hoc test. * represents p value < 0.05. Results are representative of two independent experiments. Limits of detections are described in the methods section.
