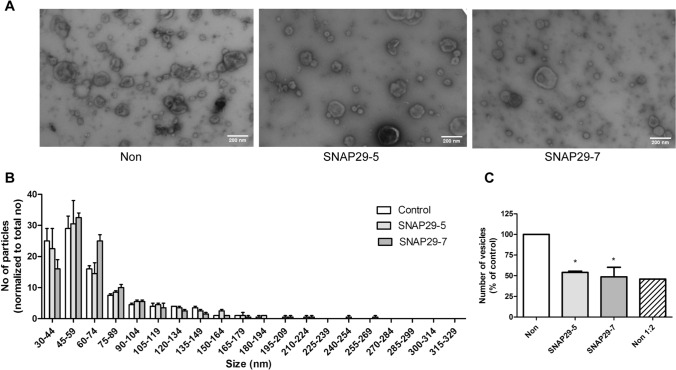
Fig. 4.
EM analysis of sEVs from SNAP29 depleted and control PC-3 cells. sEVs were isolated by sequential centrifugation, placed onto formvar/carbon coated grids, washed, stained with 4% uranyl acetate and imaged on a JEOL-JEM 1230 at 80 kV. A Representative images of sEVs from SNAP29 depleted and control (non) cells. Size bar (200 nm) is indicated. B Size distribution of sEVs shown as number of particles normalized by total number of particles for each condition. Five images per condition were analyzed by TEM ExosomeAnalyzer. The data shows mean + SEM from three independent experiments. C Number of particles shown as percentage of control. Total number particles were counted in the same images used to prepare B. The data shows mean + SEM from three independent experiments

