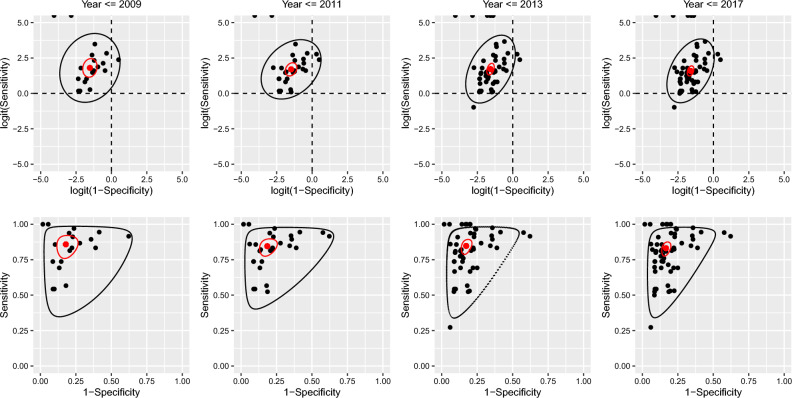
Figure 2.
Prediction and confidence regions through time (FPR = 1 − specificity, TPR = sensitivity). Black dots are the study specific estimates. The red dot is the pooled estimate. The black line indicates the prediction region. The red line is the confidence region. The top panel show the estimates and regions in logit-space, while the bottom panel are in the probability-space. (1) The change in the estimated correlation between sensitivity and 1 − specificity is reflected in the orientation and size of the minor axes of the prediction ellipses in the top row of figure. The orientation of the ellipses relates to the “slope” linking TPR and FPR observations. The strength of the correlation is depicted by the width of the ellipses about their minor axis.)

