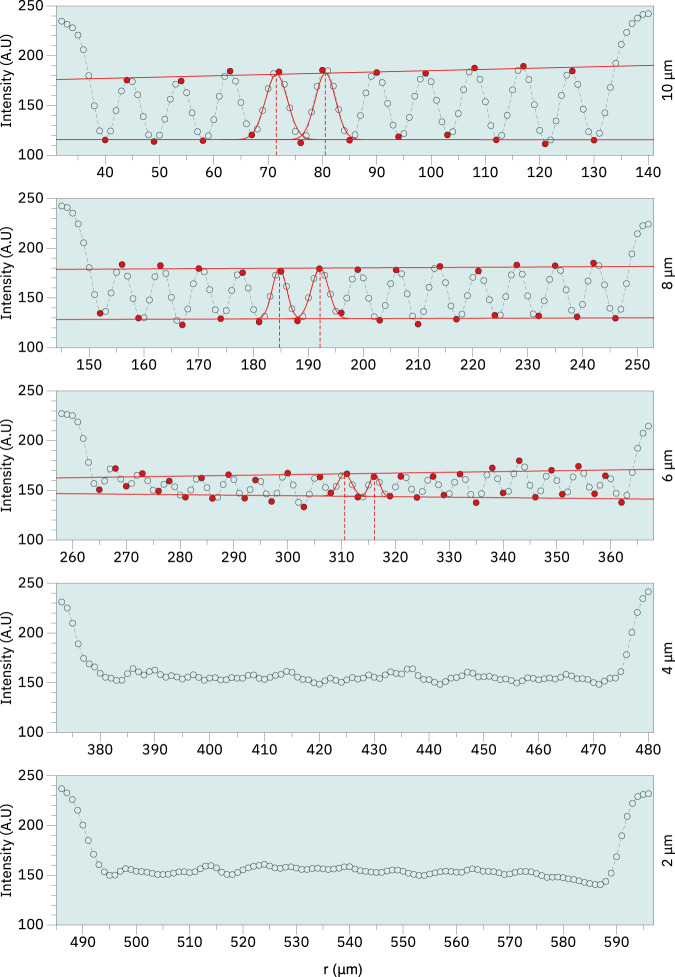
Fig. 13.
Image cross section of reference region 1A obtained from the vertical bar pattern reference. Measurement of the cross sections obtained from the bar pattern reference with linewidths between 10-2 μm. Image contrast was estimated according to Eq. 2 by calculating a linear fit passing through the maximum and minimum points shown in red. The calculated contrast values were approximately 0.22, 0.17 and 0.07 respectively for 10 μm, 8 μm and 6 μm. Peak distance was obtained from fitting a Gaussian curve in subsequent peaks and calculating the distances between the curve centers. The estimated peak distances were approximately 9 μm, 7 μm and 6 μm for 10 μm, 8 μm, and 6 μm lines respectively. Neither contrast nor peak distance was calculated for 4 μm and 2 μm due to the profiles not showing well resolved peaks.

