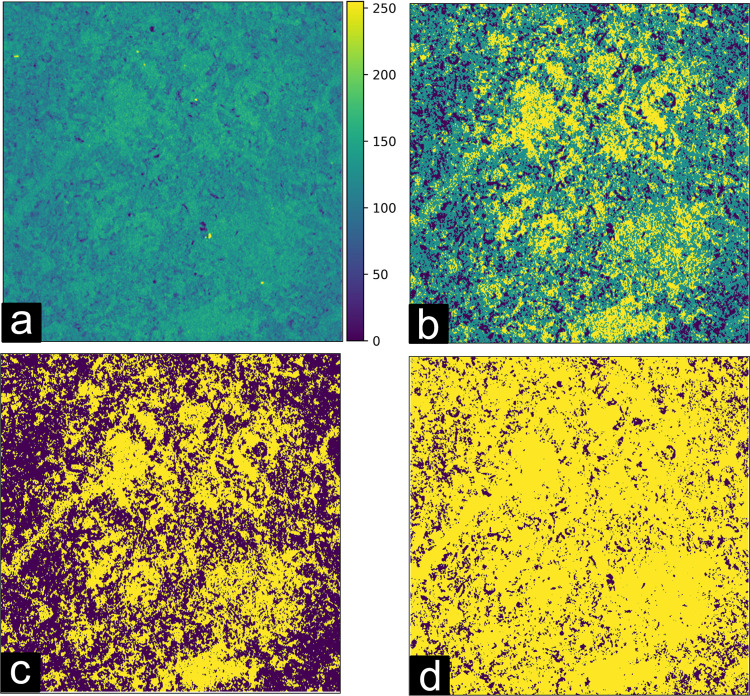
Fig. 6.
Effect of the segmentation algorithm on computed porosity. (a) Filtered grayscale image from sample 5A. The colorbar represents the grayscale level from 0 to 255. (b) Processed image segmented by means of the Multi-Otsu algorithm (n = 3) shows three distinct phases: the solid matrix in yellow, void space in black, and the intermediary class in green. (c) Segmented images using the Otsu algorithm and (d) Multi-Otsu method after merging the solid matrix and intermediary classes. Yellow represents the calculated solid matrix from merging the two classes and purple represents the void space. The side length of each image is 5.625 mm.

