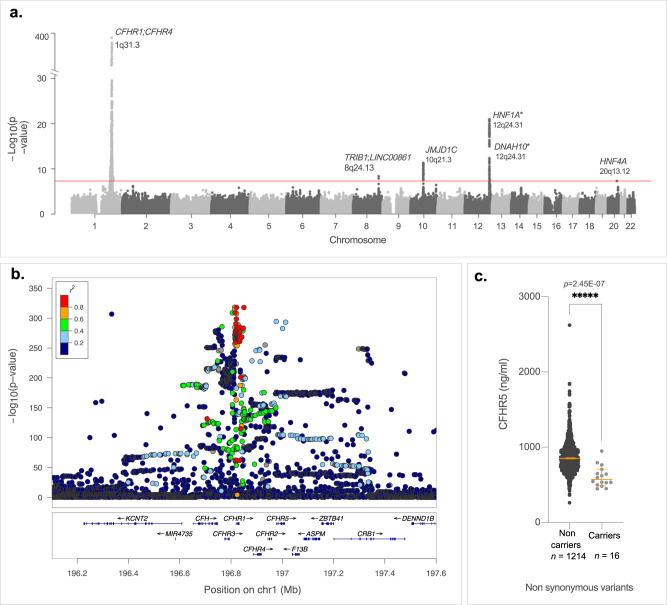
Fig. 4. GWAS analysis identifies a CFHR5 pQTL on Chromosome 1 q31.3.
a Manhattan plot of the meta-analysis on INVENT-MVP consortium resources [17] showing six loci associated with CHFR5 plasma levels and VTE risk: CFHR1, CFHR4 (rs10737681, p = 2.94E-396), HNF1A (rs2393776, p = 1.48E-21), JMJD1C (rs7916868, p = 4.61E-12), TRIB1 (rs28601761, p = 4.39E-09), DNAH10 (rs7133378, p = 2.43E-08) and HNF4A (rs1800961, p = 4.97E-08). Lead SNPs at HNF1A and DNAH10 are rs2393776 and rs7133378, respectively. They are ~3 Mb apart and do not show any linkage disequilibrium (pairwise r2 = 0). b Regional association plot127 at the Chromosome 1 locus covering >10 Mb from CFHR1 to CFHR5 around the lead SNP associated with CFHR5 plasma levels. c CFHR5 plasma levels for 16 patients who are carriers of rare non-synonymous CFHR5-associated variants (rs139017763, rs41299613 or rs35662416) and non-carriers (n = 1214). t-test, two sided. *****p < 0.00001. Dot plot (c) is represented as median value with 95% CI. See also Supplementary data 1 [Tabs_11–13]. Source data are provided as a Source Data file (c).

