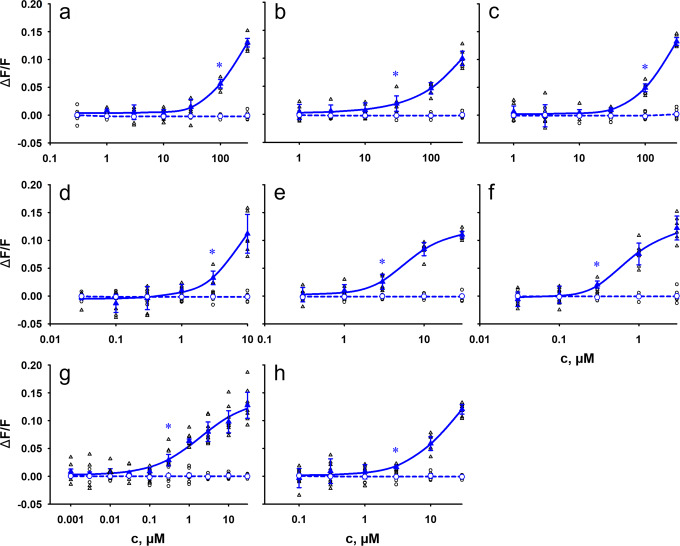
Fig. 4. Concentration-response relationships of eight tested bile acids with human TAS2R1.
HEK293T-Gα16gust44 cells were transiently transfected with human TAS2R1 (triangle, blue) and an empty vector control (circle, blue). Individual data points are depicted accordingly by black symbols. Receptor activation was recorded by increasing fluorescence intensities upon Ca2+ - release using an automated fluorometric imaging plate reader (FLIPRTETRA). For dose-response relationships, increasing concentrations of the bile acids cholic acid a), taurocholic acid b), glycocholic acid c), chenodeoxycholic acid d), deoxycholic acid e), lithocholic acid f), taurolithocholic acid g) and ursodeoxycholic acid h) were applied. The relative fluorescence intensities were mock subtracted and plotted against the bile acid concentration in µM (n = 3 biologically independent experiments). Data are presented as the mean ± standard deviation (STD). Beginning statistical significance (p < 0.01) is indicated by (*).

