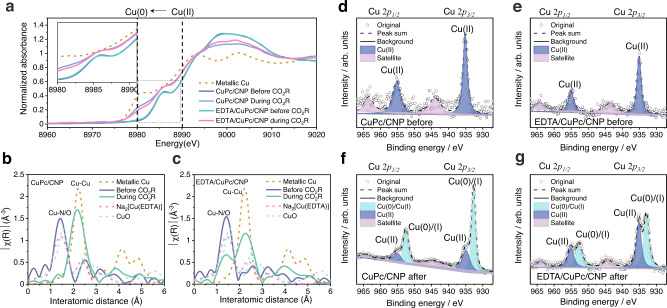
Fig. 3. Surface characterizations of catalysts.
a The in-situ XANES spectra of CuPc/CNP and EDTA/CuPc/CNP samples before and during CO2R. The metallic Cu was shown as reference. XANES, X-ray absorption near-edge structure. The in-situ EXAFS spectra of (b) CuPc/CNP and (c) EDTA/CuPc/CNP before and during CO2R. The metallic Cu, CuO, and Na2[Cu(EDTA)] samples are shown as references. EXAFS, extended X-ray absorption fine structure. The in-situ experiments were all performed at 100 mA cm−2, the current condition for the best CO2R performance. XPS Cu 2p spectra of (d) CuPc/CNP, and (e) EDTA/CuPc/CNP before CO2R. XPS Cu 2p spectra of (f) CuPc/CNP, and (g)EDTA/CuPc/CNP after CO2R. XPS, X-ray photoelectron spectra.

