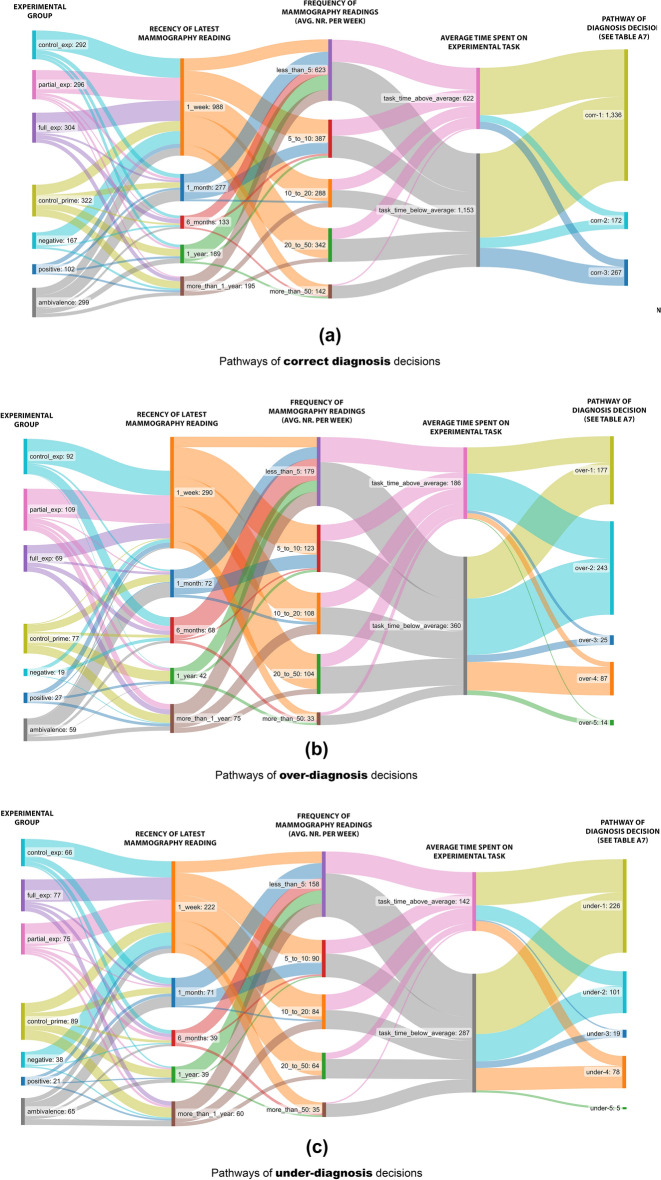
Figure 8.
Pathways of (a) correct, (b) over-diagnosis, and (c) under-diagnosis decisions. In these Sankey diagrams, the first column depicts which experimental group participants were in, where the 3 top groups represent the explainability groups (study 1), and the bottom 4 groups represent the attitudinal priming groups (study 2). The second column represents how recent participants have the experience of conducting their latest mammography reading. The third column represents how many mammography readings a participant had performed per week on average. The fourth column represents whether a participant spent overall more or less than average time on the experimental tasks. The fifth column shows which pathway of a diagnosis decision is followed.

