Figure 3.
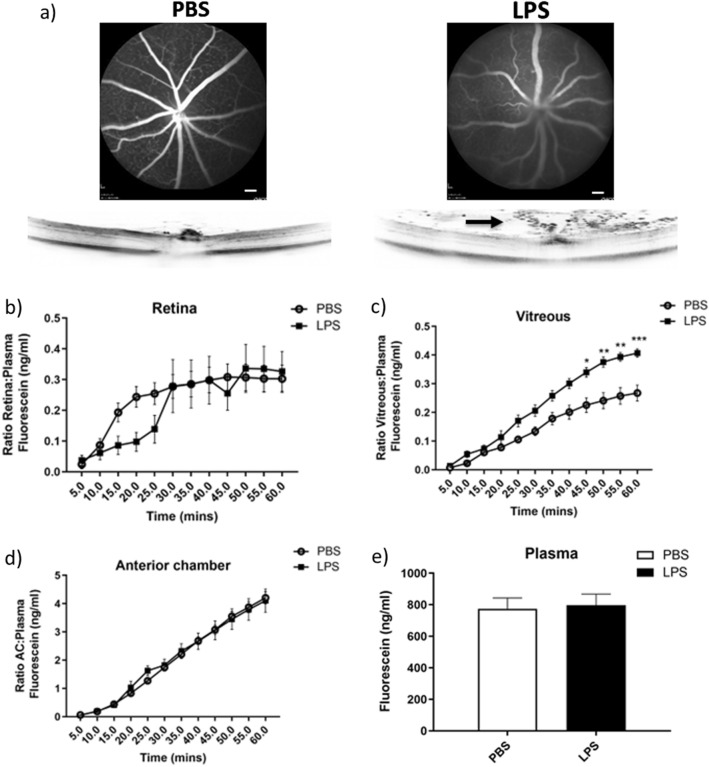
Application of the mouse fluorophotometer in the endotoxin-induced uveitis model. LPS (1 ng) or PBS was injected intravitreally into C57Bl/6J mice eyes, and 24 h later, fluorophotometry, OCT and fluorescein angiography were performed from mice injected with 50 mg/kg fluorescein subcutaneously. (a) Representative fluorescein angiography (upper panels) and OCT images (lower panels), from PBS (left) and LPS (right) treated mouse eyes 50 min after fluorescein administration. Arrow in the OCT image from the LPS-injected eye shows the presence of infiltrating immune cells in the vitreous. (b–d) Time courses quantifying levels of fluorescein in (b) the retina, (c) the vitreous, and (d) the anterior chamber using fluorophotometry revealed no significant differences in fluorescein levels in the retina and anterior chamber between PBS and LPS treatment. However, in the vitreous, a significant increase at the later time points from 45 to 60 min was observed following LPS treatment. Data shown in (b–d) are corrected to plasma levels of fluorescein. (e) Plasma levels of fluorescein were not significantly different between PBS and LPS treatment groups. Scale bars = 500 µm. N = 5–8 eyes per time point. *P < 0.05, **P < 0.01, ***P < 0.001, using Two-way ANOVA with repeated measures, followed by Bonferroni’s multiple comparisons. Data are given as means ± SEM. PBS = phosphate buffered saline; LPS = lipopolysaccharide.

