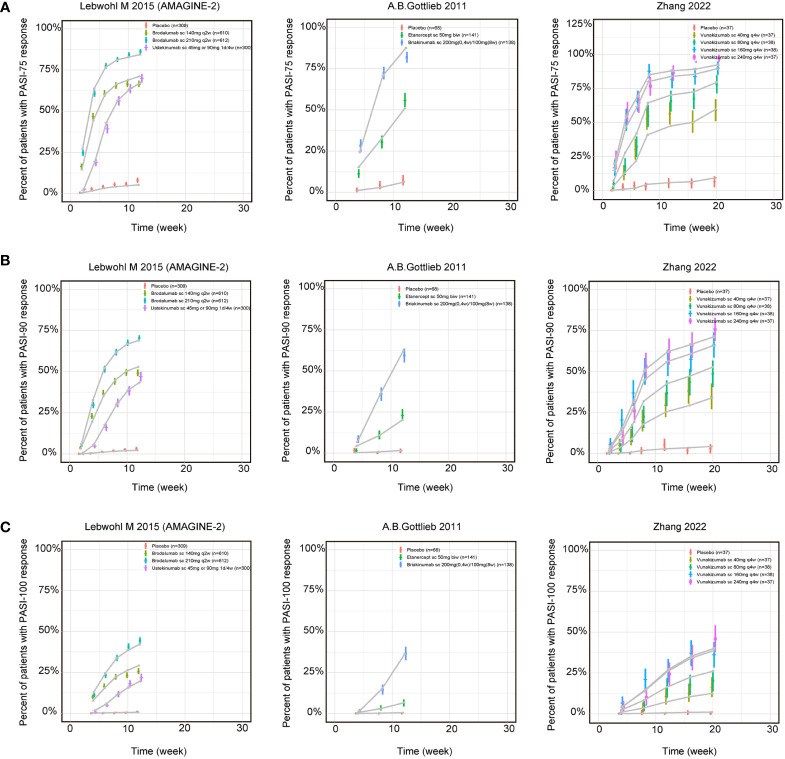
Figure 2.
Model fitted time-course plots of response rate for (A) PASI75, (B) PASI90 and (C) PASI100 for representative trials. Color symbols and vertical bars are observed mean and calculated weight of time points; gray symbols and lines are the model predictions. PASI, Psoriasis Area and Severity Index score; PASI75, PASI90 and PASI100, the proportion of patients achieving ≥75%, 90% and 100% respectively reduction from baseline PASI; s.c., subcutaneous injection; w, week; biw, twice weekly; q2w, once every 2 weeks; q4w, once every 4 weeks.

