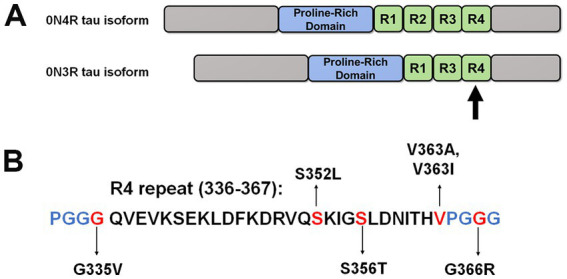
Figure 1.

Schematic of 0N4R and 0N3R tau isoforms and tau mutants investigated in this study. (A) This diagram depicts the overall structure of 0N4R and 0N3R tau isoforms with major domains. Within the MT binding region, R1 to R4 represent the MT binding repeats. (B) Specific amino acid sequence of the fourth repeat is shown. The positions of tau mutations are highlighted in red. Blue letters represent the other amino acids that comprise the PGGG motifs within each MT repeat.
