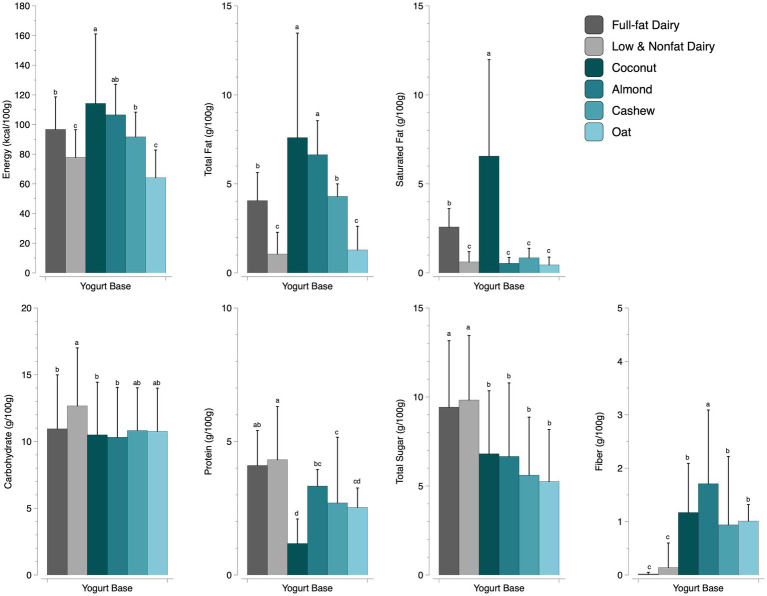
Figure 2.
A comparison of macronutrients by yogurt base (p ≤ 0.001; values are reported as mean + SD). Different letters within a macronutrient indicate significant differences between yogurt bases. For every macronutrient, we analyzed full-fat dairy (n = 159), low and nonfat dairy (n = 303), coconut (n = 61), almond (n = 44), cashew (n = 30), and oat (n = 15) yogurts.

