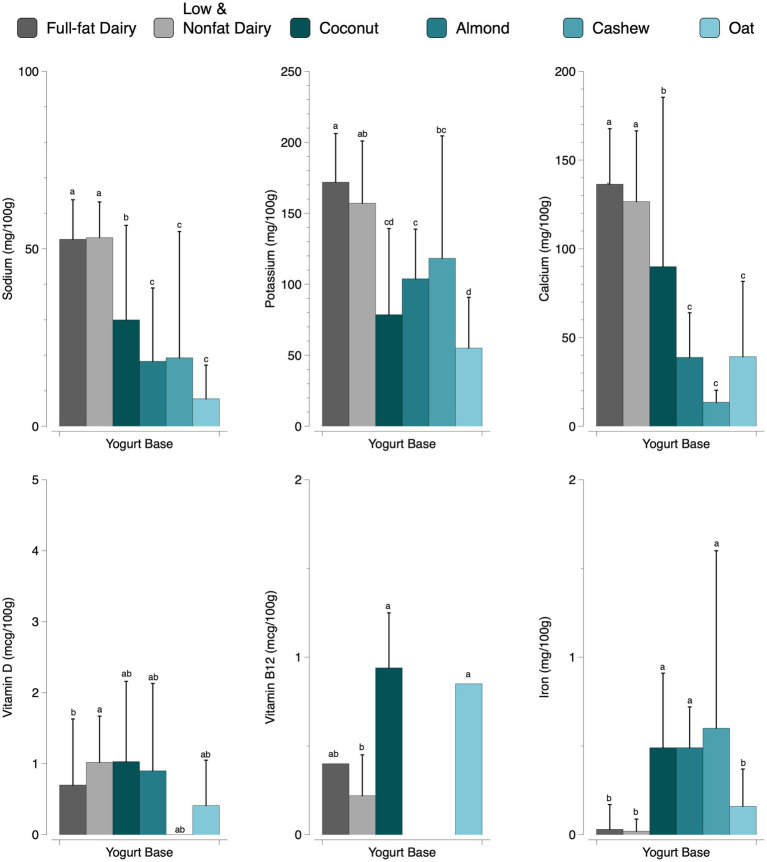
Figure 3.
A comparison of micronutrients by yogurt base (p ≤ 0.002; values are reported as mean + SD). Different letters within a micronutrient indicate significant differences between yogurt bases. Some products did not report all micronutrients. The following bases (full-fat dairy, low and nonfat dairy, coconut, almond, cashew, and oat, respectively) reported sodium (159, 303, 61, 44, 30, 15); potassium (94, 213, 31, 27, 11, 15); calcium (159, 303, 60, 44, 30, 15); vitamin D (79, 258, 36, 36, 4, 13); vitamin B12 (1, 5, 25, 0, 0, 4); and iron (159, 303, 60, 44, 30, 14).

