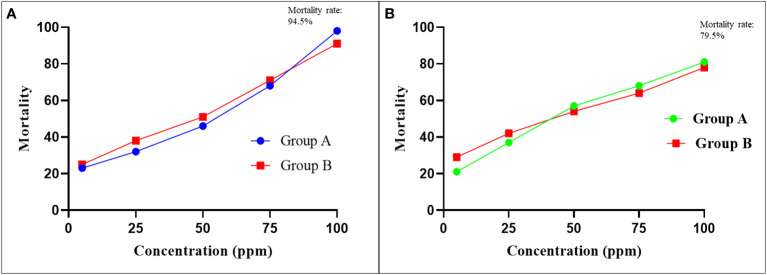
Figure 2.
The LIT based average larval mortality of Rhipicephalus microplus. (A) Plotted mortality curves showing LC50 relationship between average larval mortality with respect to applied concentrations of cypermethrin (B) Comparative probit mortality curves showing LC50 relationship between average larval mortality and acaricide dose (ppm concentrations) for amitraz. The horizontal axis indicates log concentration, while the vertical axis represents mortality.

