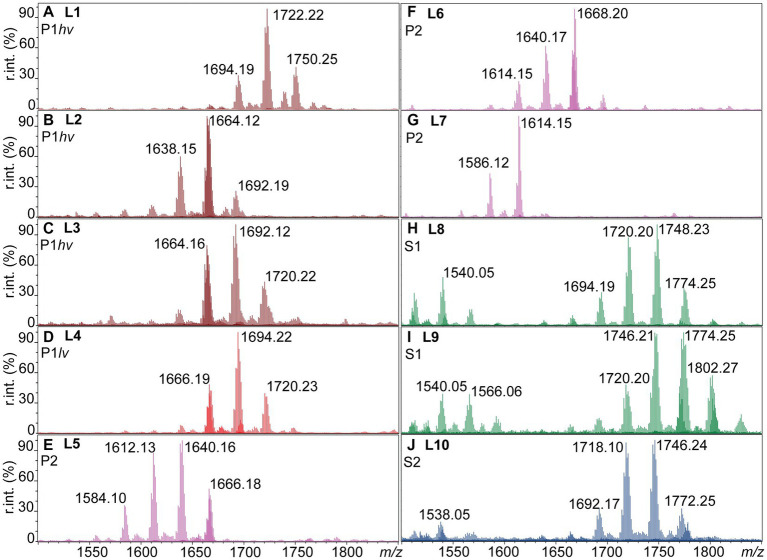
Figure 1.
Ten lipid A profiles identified within the individual Leptospira subclades (L1-L10). One microliter of logarithmic cell suspensions in MS-grade water was spotted on a MALDI plate and subjected to FLAT (Sorensen et al., 2020). MS1 scans were acquired in the negative ion mode, relative intensities (r. int.) are shown. (A–C) P1hv group (dark red). (D) P1lv group (light red). (E–G) P2 subclade (purple). (H,I) S1 subclade (green). (J) S2 subclade (blue). Lipid A profiles of the individual Leptospira species can be found in Supplementary Figures S1–S3, and the information is summarized in Table 2.

