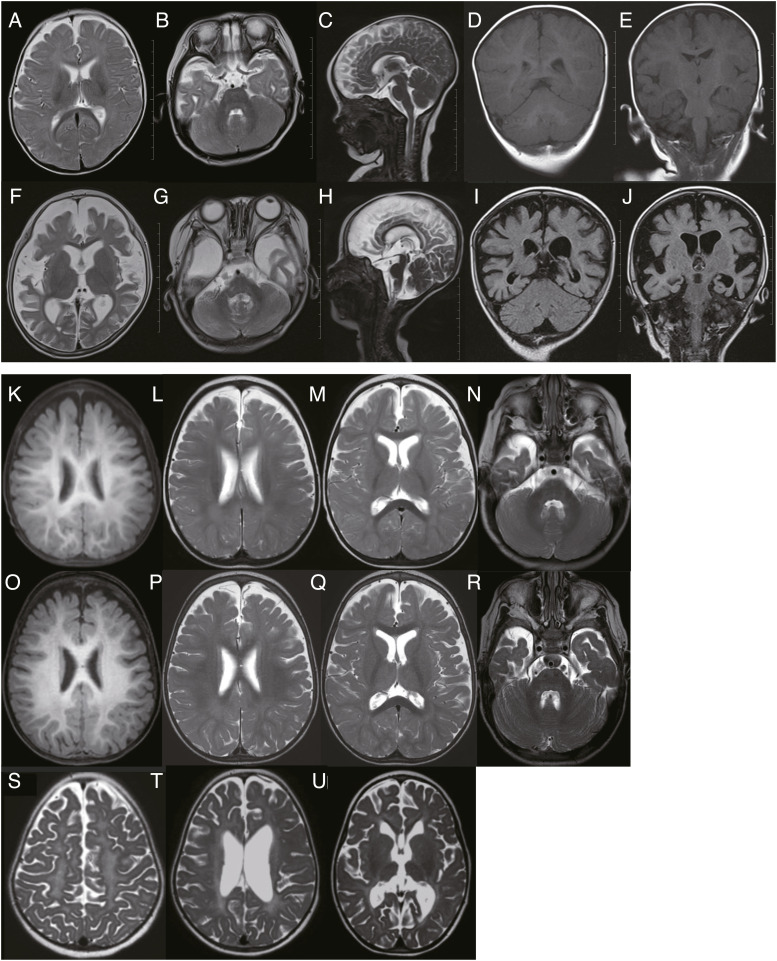
Figure 2. Brain MRI images of patients 1 and 2.
(A, B, C, D, E) MRI at the age of 7 mo was mostly normal in patient 1. 1 scale: 1 cm. (F, G, H, I, J) MRI at 1 yr and 7 mo indicated severe diffuse cerebral atrophy without cerebellar atrophy in patient 1.1 scale: 1 cm. (K, L, M, N) MRI at the age of 12 mo indicated mild cerebral atrophy and normal myelination without cerebellar atrophy in patient 2. (O, P, Q, R) MRI at 1 yr and 7 mo indicated mild cerebral atrophy and normal progression of the myelination without cerebellar atrophy in patient 2. (S, T, U) MRI at 6 yr indicated gray matter atrophy along with cortical atrophy and secondary peritrigonal white matter involvement in patient 2. Scales could not be shown on (K, L, M, N, O, P, Q, R, S, T, U) (from patient 2) as original MRI data could not be obtained in a reasonable time frame because patient 2 passed away. (A, B, C, F, G, H, L, M, N, P, Q, R, S, T, U): T2-weighted images; (D, E, K, O): T1-weighted images; (I, J): fluid attenuated inversion recovery.

