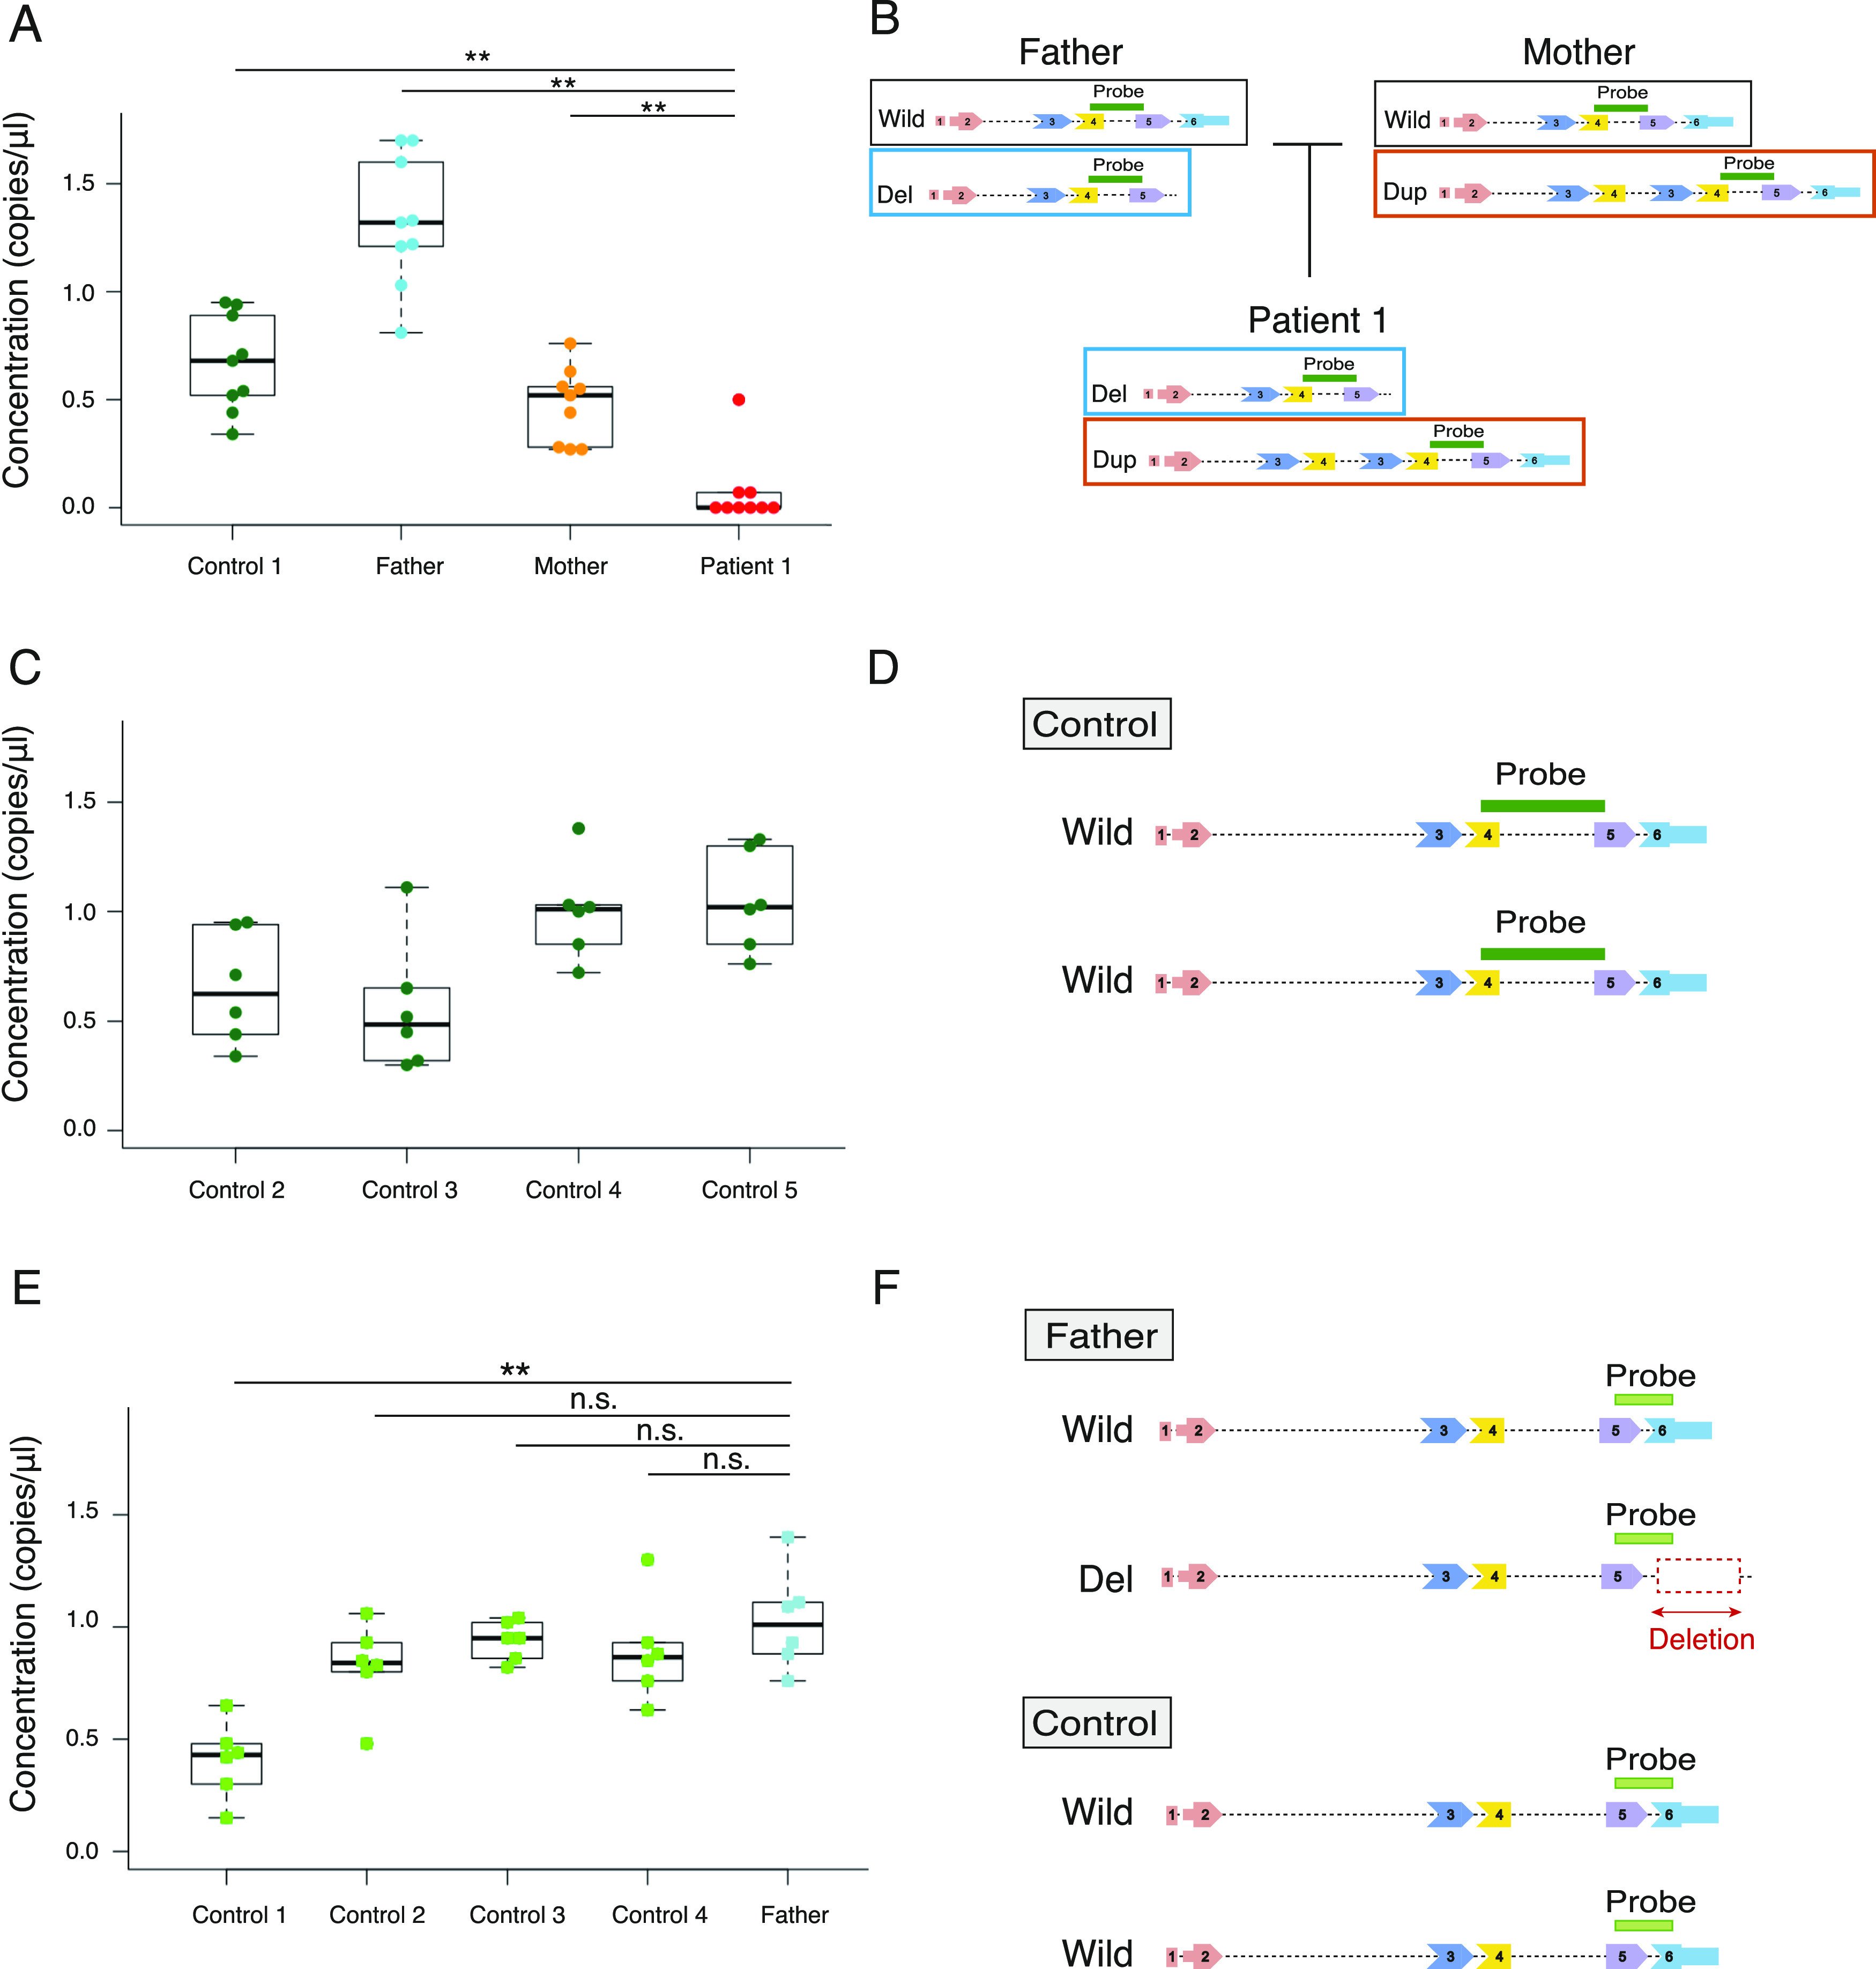
Figure 4. Highly sensitive FGF12 expression analysis in LCLs of family 1 and controls using ddPCR.
(A) FGF12 expression in LCLs of patient 1, her parents, and an unrelated control using ddPCR. The plot shows distributions of the absolute number of copies/μl of FGF12 transcripts in LCLs (y = concentration [copies/μl]). Data are shown as box and whisker plots (25th–75th percentiles, median). Mann–Whitney U tests performed on medians of the triplicate reactions in three technical replicates (n = 9). **P < 0.01. (B) Schematic presentation of intragenic SVs in FGF12 of family 1 and the position of the TaqMan probe used in the assay (A) (Table S3). Respective FGF12 alleles in patient 1 and her parents are shown, with the location of the TaqMan probe covering exons 4 and 5. (C) FGF12 transcript levels in LCLs of four unrelated controls by ddPCR. The plot shows the number of copies/μl of FGF12 transcripts from the LCLs (y = concentration [copies/μl]). Data are shown as box and whisker plots (25th–75th percentiles, median). The ddPCR reactions were repeated twice in triplicates (n = 6). (D) Schematic presentation of the TaqMan probe position used in the assay (C) spanning exons 4 and 5 (Table S3). (E) The ASE analysis of FGF12 transcript levels in LCLs of the father of patient 1 and unrelated controls using ddPCR. The plot shows distributions of the number of copies/μl of FGF12 transcripts from the LCLs (y = concentration [copies/μl]). Data are shown as box and whisker plots (25th–75th percentiles, median). Mann–Whitney U test performed on medians of the triplicate reactions in two independent experiments (n = 6). **P < 0.01; n.s., no significance. (F) Schematic presentation of SV in the father and the position of the TaqMan probe used in the assay (E) (Table S3). As the TaqMan probe spanned exon 5 and the last exon (exon 6), the deletion allele could not be amplified in the father.
Source data are available for this figure.

