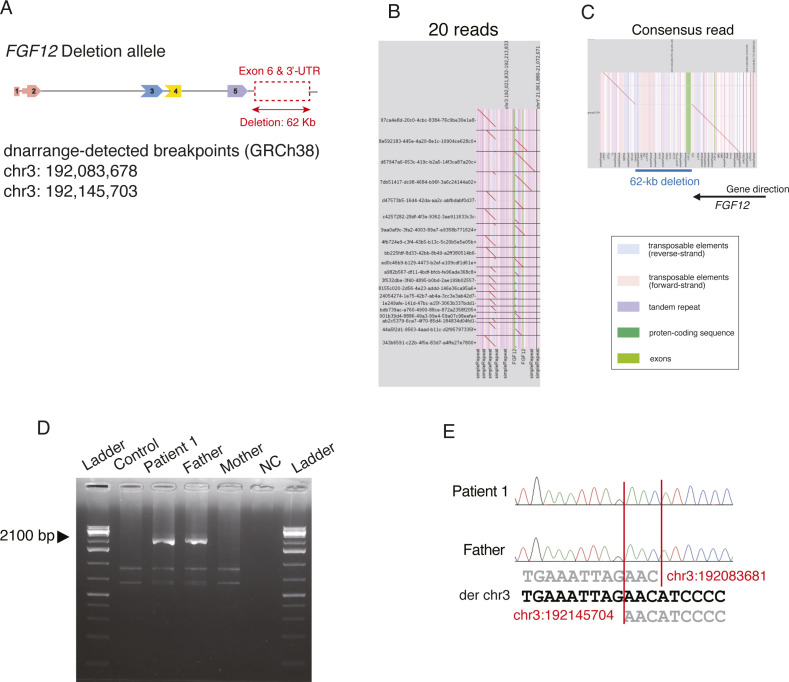
Figure S2. Characterization of a deletion allele in FGF12 of patient 1.
(A) Schematic presentation of a deletion allele in patient 1. The positions of dnarrange-detected breakpoints in chromosome 3 were 192,083,678 and 192,145,703. (B) Dot plots of 20 reads from the deletion allele. (C) Dot-plot picture of the consensus sequence made by lamassemble. The red line shows the alignment between the reference sequence and chr3:192,045,070–192,202,106 with a 62-kb partial deletion involving exon 6 and the 3′ UTR. The vertical stripes depict annotations in the reference genome with different colors: transposable elements (blue, reverse strand; pink, forward strand), tandem repeats (purple), protein-coding sequences (dark green), and exons (green). There is a 62-kb deletion at the breakpoints, and the blue line shows the extent of the deletion in the genome. The direction of a black arrow indicates the direction of the gene. (D) Deletion breakpoint PCR in the patient and her parents. Breakpoint PCR of the patient and her parents confirmed that the FGF12 deletion was derived from the father. The PCR product was 2,100 bp in size. Control, an unrelated healthy control; NC, a negative control (no DNA); Arrowhead, breakpoint PCR product spanning the deletion. (E) Electropherogram of deletion breakpoints by Sanger sequencing. dnarrange-predicted breakpoints made from lamassemble were nearly identical (only one or three bases different to the Sanger sequencing results).

