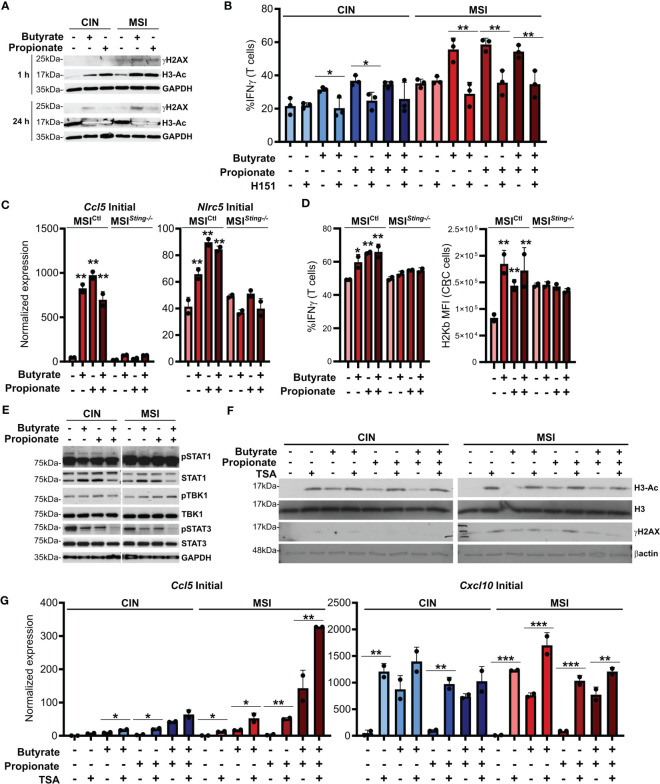
Figure 4.
SCFAs induce DNA damage in CRC cells that promotes cGAS/STING signaling and CD8+ T cell activation. (A) MSIOVA and CINOVA CRC cells were treated with 50 mM butyrate, 50 mM propionate or a combination of the two for 1 h or 24 h before harvesting proteins for analysis. (B) CRC cells were stimulated as in (A) for 24 h in the presence or absence of 10 μM H151. SCFAs were washed off and OVA-specific OTI CD8+ T cells were then added and cocultured with the CRC cells for 24 h before measuring T cell IFNγ production. (C) Sting was knocked down in MSI CRC cells (MSI Sting-\- ) and compared to a Scramble control (MSI Ctl ). Cells were treated with 50 mM butyrate, 50 mM propionate or a combination of the two for 24 h before harvesting RNA for qPCR analysis. (D) MSI Sting-/- and MSI Ctl CRC cells were stimulated as in (C) for 24 h SCFAs were washed off, cells were pulsed with 1 µg/ml SIINFEKL peptide, and OVA-specific OTI CD8+ T cells were then added and cocultured with the CRC cells for 24 h before measuring T cell IFNγ production or surface CRC H2Kb expression. (E) CRC cells were treated as in (A) for 24 h before harvesting for protein analysis. (F) CRC cells were treated as in (A) for 24 h in the presence or absence of 1 μM TSA. (G) CRC cells were treated as in (A) in the presence or absence of 1 μM TSA. Cells were then harvested immediately (“Initial”) or cultured for an additional 24 h in the absence of additional treatments (“Sustained”). 100 U/ml IFNγ was included with the initial SCFA treatment as indicated. Gene expression was then analyzed by qPCR. For all panels, n = 3 experimental repeats with 2-3 biological replicates per experiment. Representative graphs from a single experiment are shown. For panels (B, G): *p ≤ 0.05, **p ≤ 0.01, ***p ≤ 0.001. For panels (C, D) relative to the untreated control: *p ≤ 0.05, **p ≤ 0.01.

