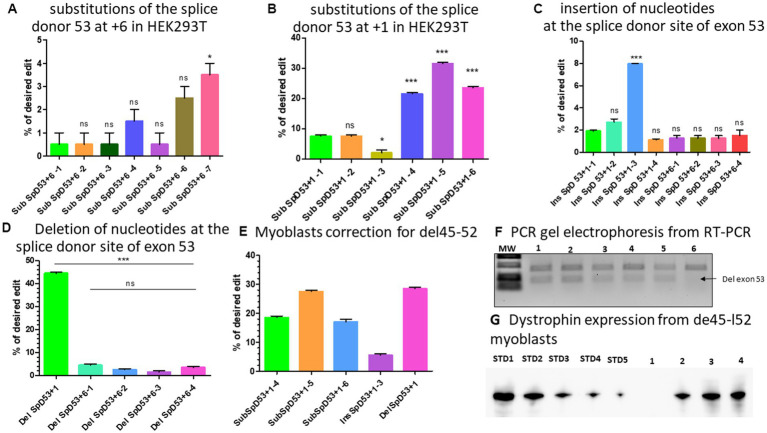
Figure 6.
modifications at the splice site of exon 53. (A) Represents the editing percentage of Prime editing substitution at the position +6 of the splice donor 53. (B) Represents the editing results of Prime editing substitution at the position +1 of the splice donor 53. Experiments were done in independent triplicates in HEK 293 T cells. (C) Represents the Prime editing results for insertion of nucleotides at the splice donor site of exon 53. (D) Shows the Prime editing percentage for the deletion of nucleotides at the splice donor site of exon 53. Experiments were done in independent triplicates in HEK 293 T cells. (E) Represents the editing percentages of Del45-52 myoblasts treated with different epegRNAs. (F) Represents the gel electrophoresis results from the PCR of RT-PCR samples. 1, 2, 3, 4, 5, and 6 represent, respectively, the SubSpD53+1–4, SubSpD53+1–5, SubSpD53+1–6, InsSpD53+1–3, DelSpD53+1–1, and the negative control (untreated Del45-52 patient myoblasts). The lower size bands confirm the exon 53 skipping. (G) Represents the dystrophin expression detected by western blot after the correction of Del45-52 patient myoblasts. STD1, STD2, STD3, STD4, and STD5 correspond to positive control standard bands (untreated healthy myoblasts), and 1, 2, 3, and 4 correspond, respectively, to the negative control (untreated Del45-52 patient myoblast), SubSpD53+1–4, SubSpD53+1–5 and DelSpD53+1–1. The editing percentage of between pegRNAs were compare using the Kruskal Wallis test and the Bonferroni post-test. *, ** and *** indicate the level of significance for value of p < 0.05. ns indicates a nonsignificant difference.

