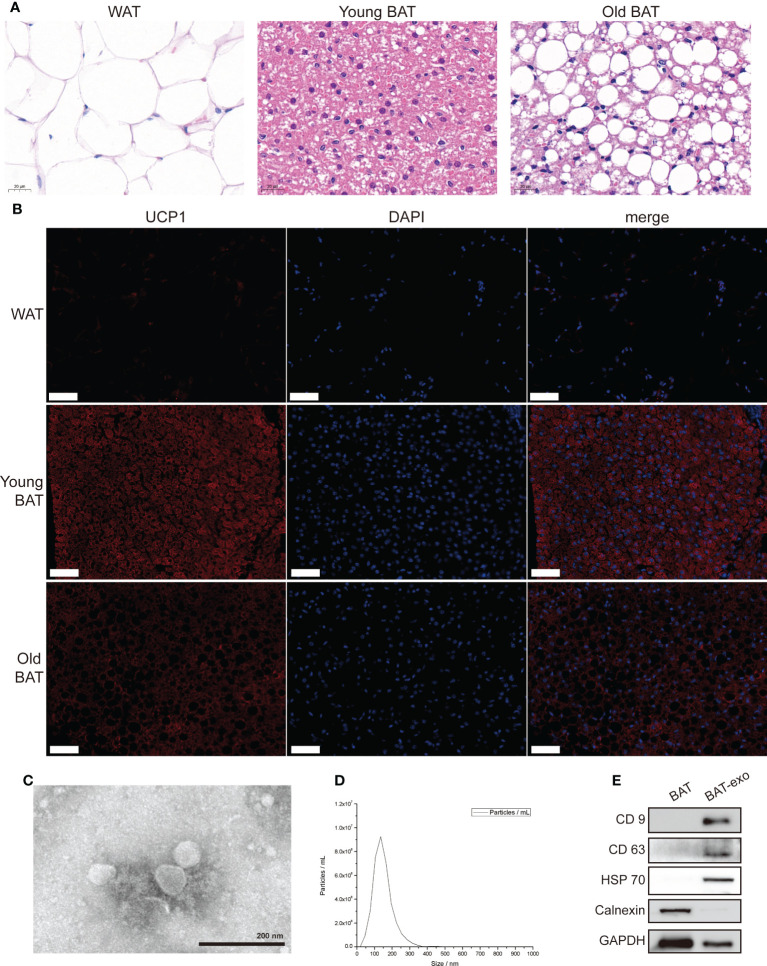
Figure 1.
Isolation and identification of BAT and BAT-exos. (A) HE staining of WAT, young BAT, and old BAT. Scale bar, 20 μm. (B) UCP1 staining of WAT, young BAT, and old BAT. Scale bar, 50 μm. (C) TEM showed exosomes presenting with the typical morphology. Scale bar, 200 nm. (D) NTA indicated that the peak diameter of the exosomes was 150.0 nm. (E) Western blot analysis of the exosome-related markers CD9, CD63, and HSP70. Calnexin was used as a negative control.

