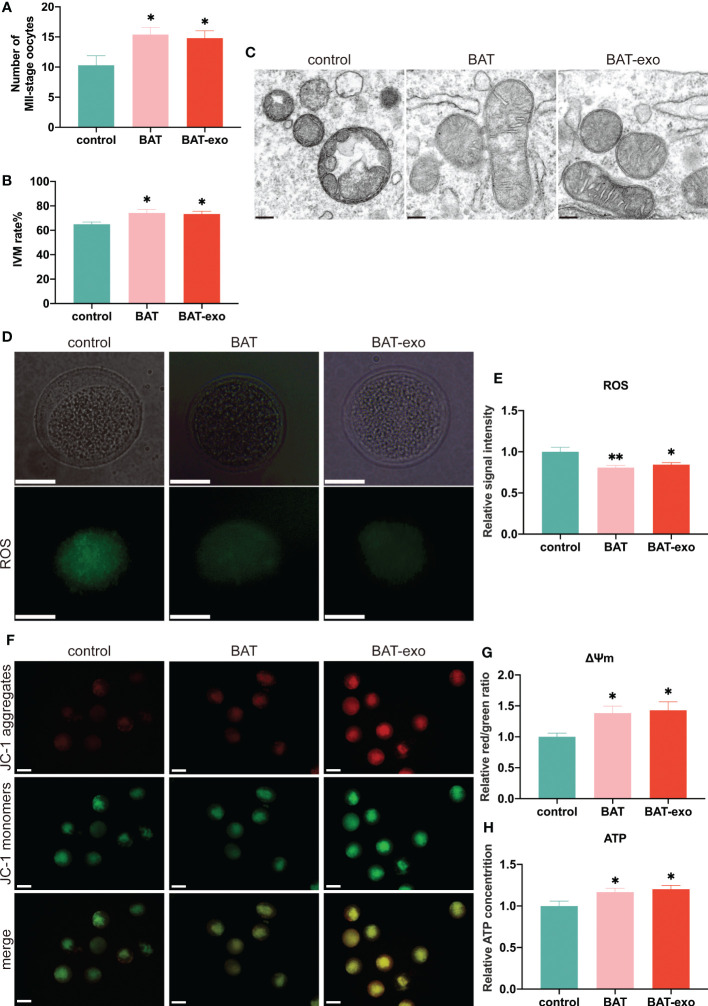
Figure 6.
BAT-exos inhibited the decline in mitochondrial function in oocytes. (A) The number of MII-stage oocytes after ovulation induction. (B) The rate of in vitro maturation (IVM). (C) The mitochondrial structure acquired by TEM. Scale bar, 200 nm. (D) BAT-exo and BAT interventions reduced the level of ROS. Scale bar, 20 μm. (E) Quantification of ROS. (F) The mitochondrial membrane potential was higher in the BAT and BAT-exo groups than in the control group. Scale bar, 50 μm. (G) Quantification of mitochondrial membrane potential. (H) BAT-exo treatment increased the ATP levels in oocytes. *p < 0.05, **p < 0.01.

