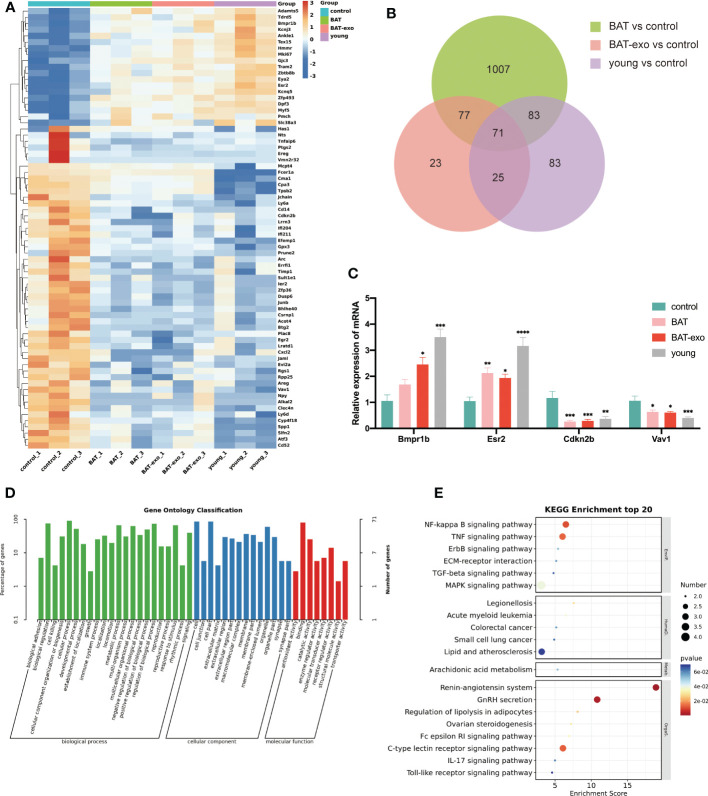
Figure 7.
BAT-exo treatment changed the expression of age-related genes in aging ovaries. (A) Heatmap of DEGs. (B) Venn diagram showed 71 overlapping DEGs in the BAT, BAT-exo, and young groups compared with the control group. (C) qPCR verified four age-related DEGs. (D) GO of DEGs. (E) KEGG of DEGs. *p < 0.05, **p < 0.01, ***p < 0.001, ****p < 0.0001.

