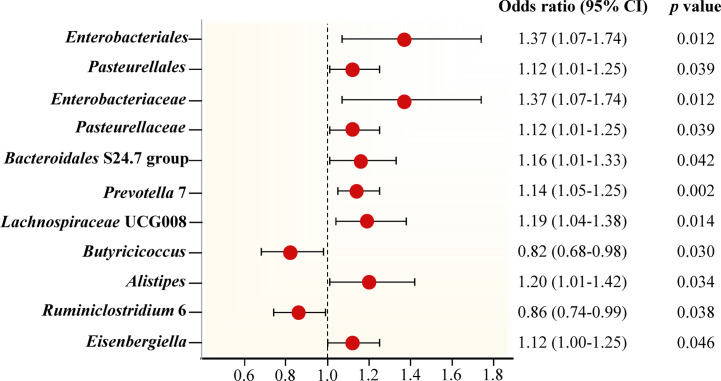
Figure 3.
Forest plot of Mendelian randomization estimates between Gut microbiota and periodontitis. The figure showed the IVW estimates of significantly periodontitis-associated gut microbiota taxa. The red dots represent the IVW estimates, and the black bars represent the 95% confidence intervals of IVW estimates. The OR > 1 indicates increased risk while< 1 indicates decreased risk.

