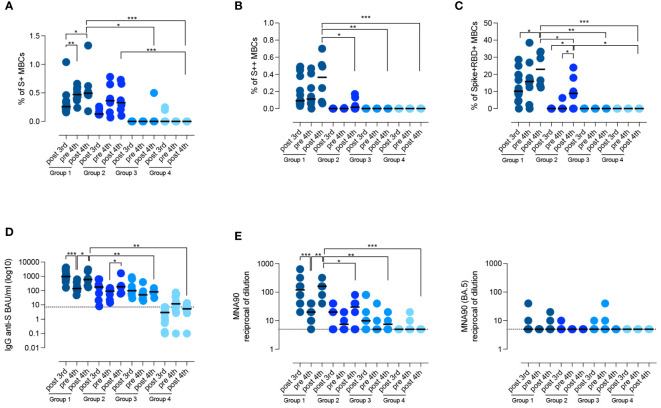
Figure 4.
Persistence of the specific response against SARS-CoV-2. (A–D) Graphs show the frequency of spike-specific S+ MBCs (A) S++ MBCs (B), RBD+ MBCs (C), the concentration of anti-S1 IgG (D) and the neutralizing antibody titers for the wild type and the BA.5 variant (E), after the 3rd dose, before and 10 days after the 4th dose in the four groups of CVIDs patients. Medians are shown as bars and the dotted line indicates the cut-off. Non-parametric Wilcoxon matched pair signed-rank test and Mann–Whitney t-test were used to evaluate statistical significance. Two-tailed P value significances are shown as *p<0.05, **p< 0.01, ***p< 0.001.

