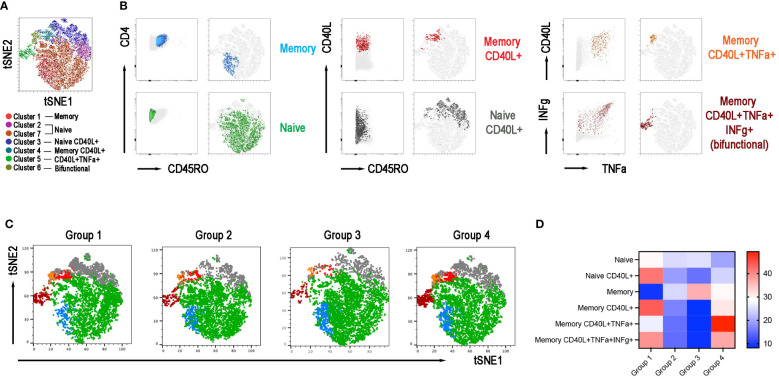
Figure 7.
CD4+ T-cell population in the 4 groups. (A) X-Shift B-cell cluster sets originated from the four concatenated groups and overlaid onto the Opt-SNE map, each cluster is indicated by a color. Naïve T cells were identified in two clusters 2 and 7 and were merged together. (B) Expression of CD45RO, CD40L, IFNγ, and TNFα for population characterization and identification. (C) Merged Opt-SNE plots for each group with relative X-Shift cluster sets overlaid onto the Opt-SNE map. (D) Heat map depicts the cluster sets abundancy (%) in the four groups.

