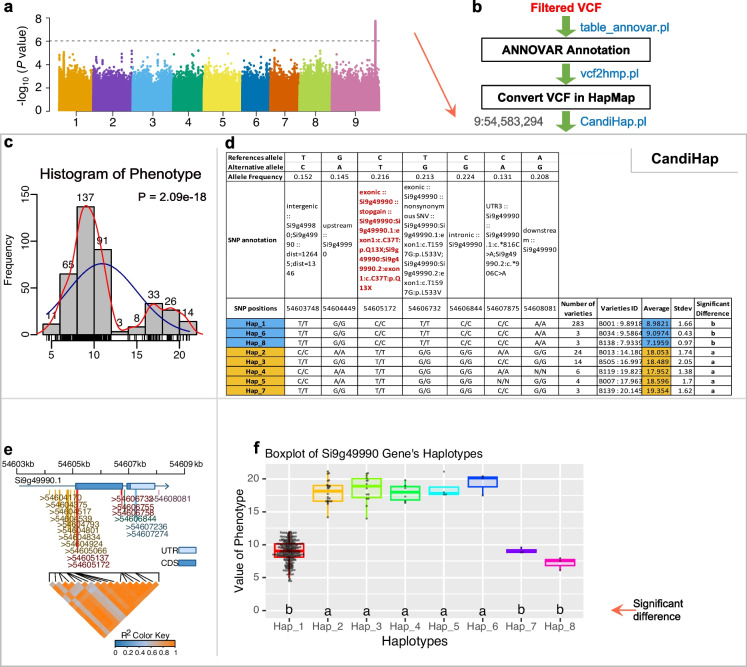
Fig. 1.
Overview of the CandiHap process. a A GWAS result. b General scheme of the process. c The histogram of phenotype and Shapiro test to check whether the data is normally distributed data or not. d The statistics of haplotypes and significant differences haplotypes are highlighted by color boxes. e Gene structure and SNPs of a critical gene. f Boxplot of a critical gene’s haplotypes and the LSD test is used to determine whether or not the difference between or among group means is significant

