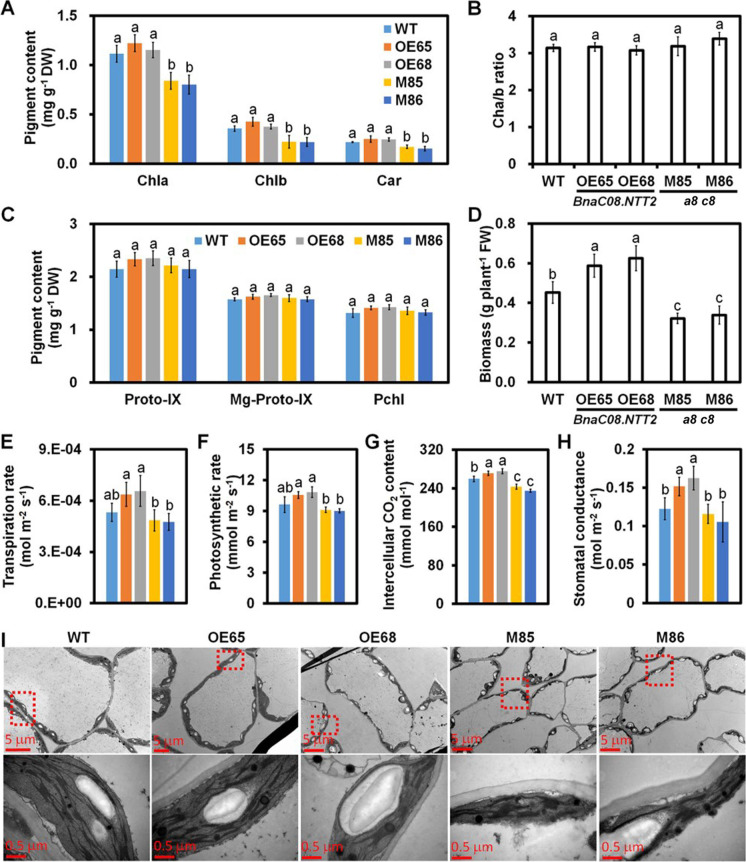
Fig. 3.
Changes in plant biomass, pigment contents, and photosynthesis efficiency in transgenic plants. A Contents of chlorophyll a and b, and carotenoid in leaves. Samples were taken from plants shown in Fig. 2A. Values are means ± SD (n = 3). Chlorophyll a, Chla; Chlorophyll b, Chlb; Carotenoid, Car. B Chlorophyll a/b ratio in leaves. Values are means ± SD (n = 3). C Contents of chlorophyll precursors when plants were 5-week-old. Values are means ± SD (n = 3). Proto-IX, protoporphyrin IX; Mg-Proto-IX, Mg protoporphyrin IX; Pchl, protochlorophyllide. D Fresh weight of 5-week-old plants. Values are means ± SD (n = 3). The indexes related to leaf photosynthesis including E transpiration rate, F photosynthetic rate, G intercellular CO2 concentration, and H stomatal conductance. Values are means ± SD (n = 3). Different letters represent significant differences at P < 0.05, based on ANOVA analysis and Duncan’s multiple-range test. I Ultra-structure of chloroplast observed under transmission electron microscope. Samples were taken from 5-week-old plants. Pictures below are enlarged image of the picture, showed in red box with dot lines

