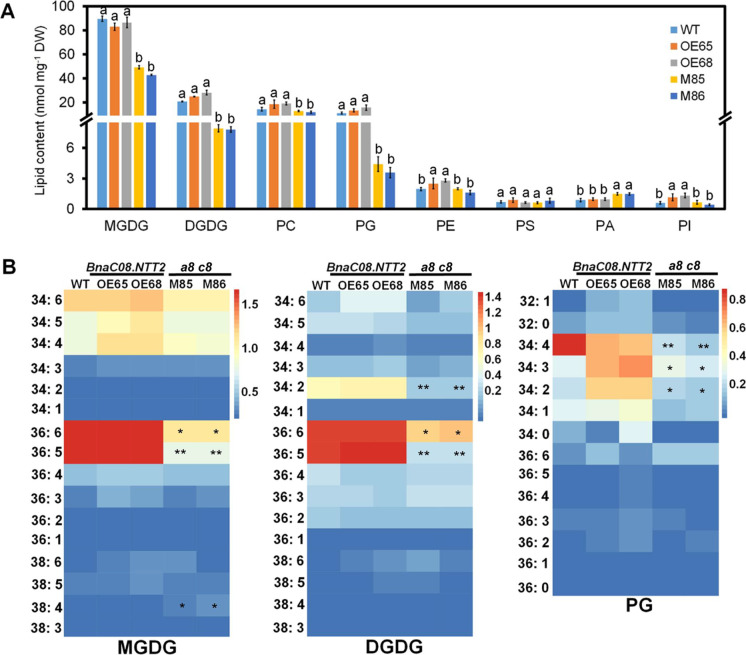
Fig. 4.
Contents and compositions of lipids in transgenic and WT plant leaves. A Comparison of glycerolipids’ contents among OE, double mutant and WT leaves. Samples were taken from 5-week-old plant leaves. Values are means ± SD (n = 5). Different letters represent significant differences at P < 0.05, based on ANOVA analysis and Duncan’s multiple-range test. B Contents of different species of MGDG, DGDG, and PG in transgenic and WT plant leaves. Average data of each species of MGDG, DGDG, and PG were normalized by a log10 calculation and then the heat map was drawn using image GP online tool (www.ehbio.com/ImageGP). Each vertical colored bar represents the log10 of concentration (nmol mg−1 dry weight) as shown in the color key. *Indicates P < 0.05 and **indicates P < 0.05, based on a student t-test. MGDG, monogalactosyldiacyglycerol; DGDG, digalactosyldiacylglycerol; PG, phosphatidylglycerol

