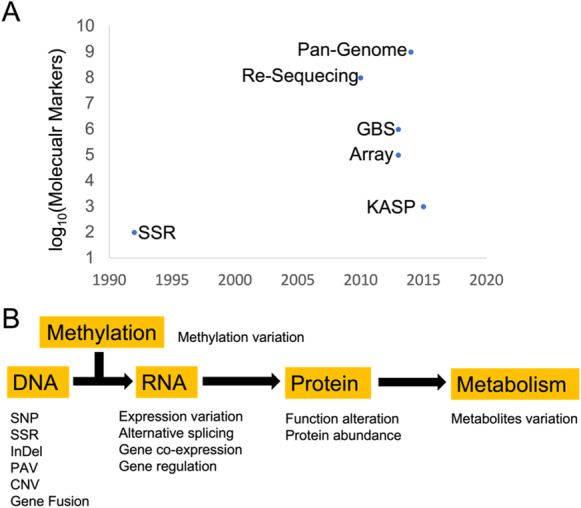
Fig. 3.

The genic and multi-omics variation for genetic basis dissection of trait. A Different genotyping platforms or technologies. The y-axis represents number of molecular markers, and x-axis indicates the time applied in soybean studies. B Omics data and the revealed polymorphisms for association studies
