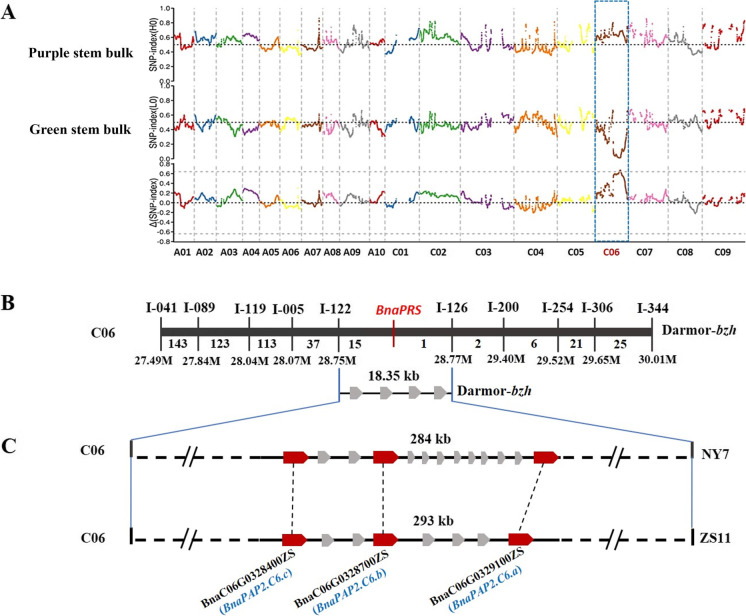
Fig. 2.
Map-based cloning of the BnaPRS gene in DH_PR. A The average value of Δ(SNP-index) plotted along the nineteen chromosomes (X-axis) of B. napus. Signals were shown on Chromosome C06. The CIs were simulated with 10,000 times (red, p < 0.01; green, p < 0.05). B Fine mapping of the BnaPRS gene between markers I-122 and I-126 on C06. The number below chromosome refers to the number of recombinants between two markers. C Schematic diagram of predicted genes in the BnaPRS locus. The broad arrows mean predicted genes in the 284-Kb and 293-Kb intervals on C06 of NY7 and ZS11, respectively. The BnaC06G0328400ZS (BnaPAP2.C6c), BnaC06G0328700ZS (BnaPAP2.C6b), and BnaC06G0329100ZS (BnaPAP2.C6a) genes were regarded as the candidate genes (red color)

